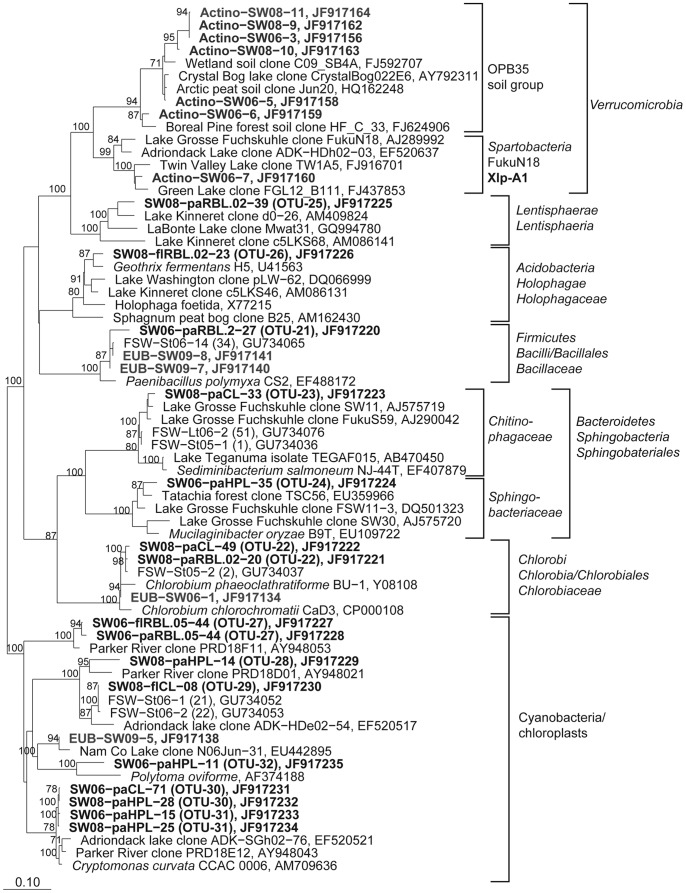
Figure 9. Phylogenetic affiliation of 16S rRNA gene sequences representing OTUs and DGGE bands to the less abundant bacterial groups and chloroplast sequences.
Maximum likelihood trees showing the phylogenetic affiliation of OTU and DGGE band sequences to less abundant bacterial groups and chloroplast sequences. Details and abbreviations are indicated in the legend to Figure 5.

