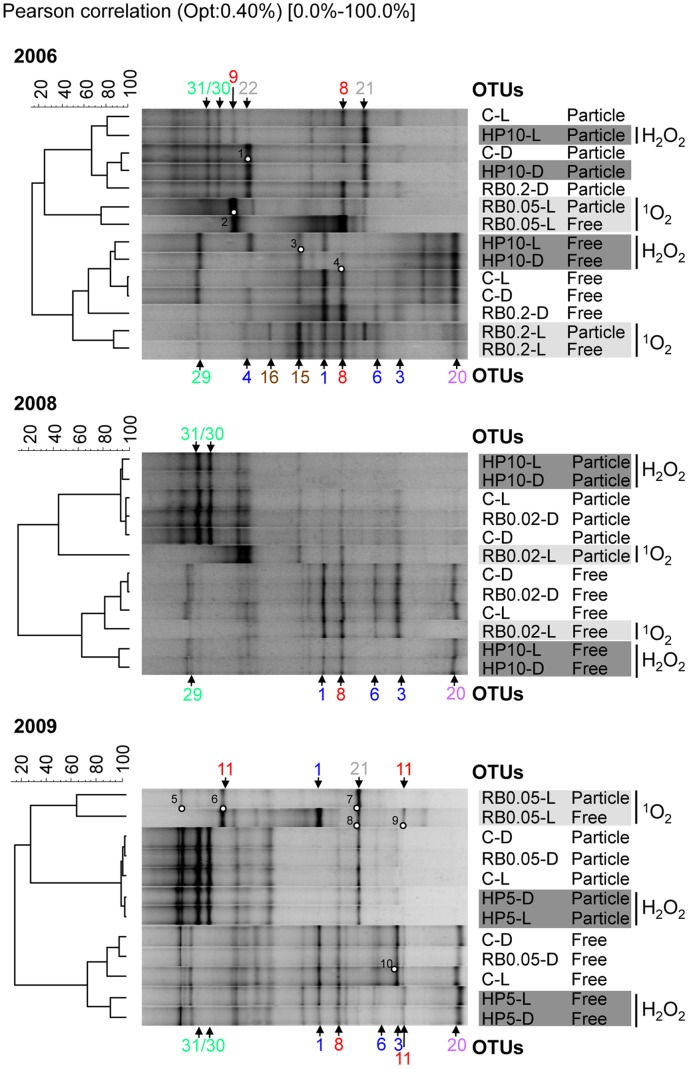
Figure 10. Cluster analysis of Bacteria RT-PCR DGGE patterns.
Cluster analysis and RT-PCR DGGE patterns of metabolically active free-living (0.22–8 μm in 2006 and 0.22–5 μm in 2008 and 2009) and particle-attached (>8 or >5 μm, respectively) Bacteria of in situ experiments 2006, 2008 and 2009. Universal Bacteria 16S rRNA gene targeting primers were used for analysis. Cluster analyses were performed in GelCompare II version 4.5 (Applied Maths) using unweighted pair-group method using arithmetic average (UPGMA) clustering based on the Pearson correlation which considers the intensity of DGGE bands. Distance matrices are shown in Fig. S4. DGGE bands marked with circles were sequenced. OTU numbers depicted next to the DGGE patterns point at DNA bands identical in DNA sequence (see Table 2). Colours of OTU numbers indicate the phylogenetic affiliation: Actinobacteria (purple), Gammaproteobacteria (brown), Alphaproteobacteria (red), and Betaproteobacteria (blue), cyanobacteria/chloroplasts (green), and other Bacteria (grey). Phylogenetic affiliations to sequenced DGGE bands are given in Fig. 5–9 and Table S6. Abbreviations are given in Fig. 1.

