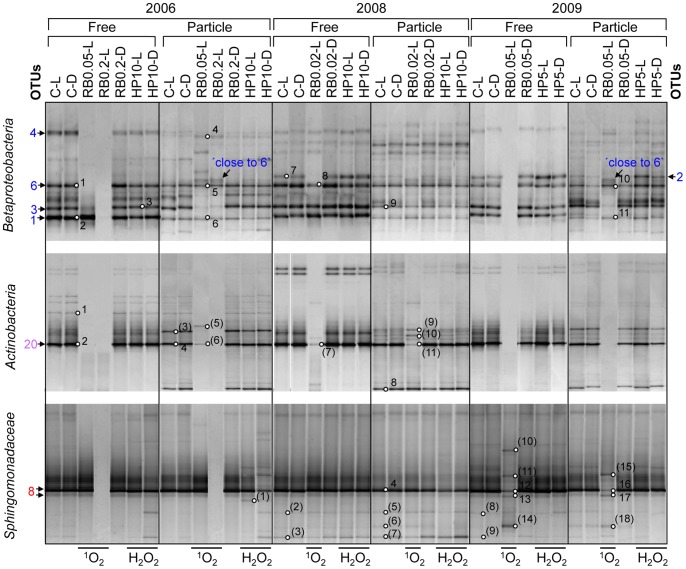
Figure 11. Group specific RT-PCR DGGE analysis.
RT-PCR DGGE analysis of metabolically active free-living (0.22–8 μm in 2006 and 0.22–5 μm in 2008 and 2009) and particle-attached (>8 or >5 μm, respectively) Betaproteobacteria, Actinobacteria, and Sphingomonadaceae after 1O2 and H2O2 exposure. Group-specific 16S rRNA gene targeting primer-systems were used for analysis. All treatments of in situ experiments 2006, 2008 and 2009 were investigated. DGGE bands marked with circles were sequenced. DGGE band numbers in brackets were not affiliated to the investigated groups. Numbers with arrows show the assignment to respective OTUs (see Table 2). Abbreviations are given in Fig. 1.

