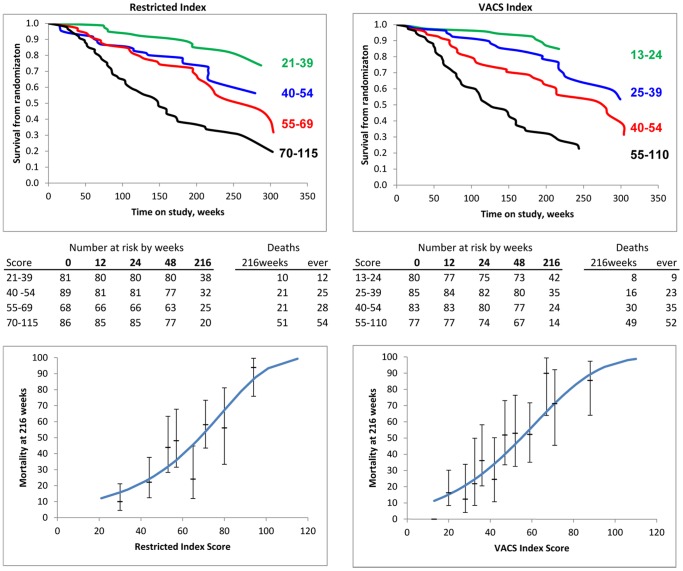
Figure 1. Mortality from Randomization Date by Risk Score.
Left: Restricted Index; Right: VACS Index. Upper panels: Kaplan-Meier plots by quartile of score. Plot ends at last death. Lower panels: Mortality at 216 weeks vs. score, Lines: Predicted mortality, Points (95% Confidence Intervals) from Kaplan-Meier estimates using five-point intervals of score (collapsed if necessary to maintain at least 5 deaths and 10 survivors in each interval).

