
Figure 2. Representative images of the magnitude MRE signal, shear waves and the magnitude complex modulus (|G*|) in a mouse.
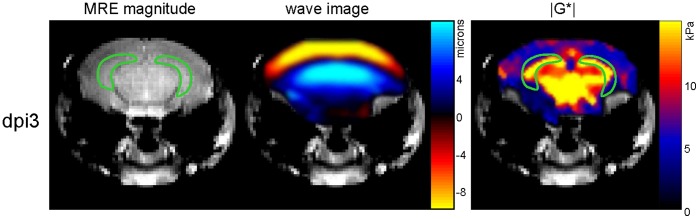
The green line demarcates the chosen region of interest in the hippocampus.
Official websites use .gov
A
.gov website belongs to an official
government organization in the United States.
Secure .gov websites use HTTPS
A lock (
) or https:// means you've safely
connected to the .gov website. Share sensitive
information only on official, secure websites.
The green line demarcates the chosen region of interest in the hippocampus.