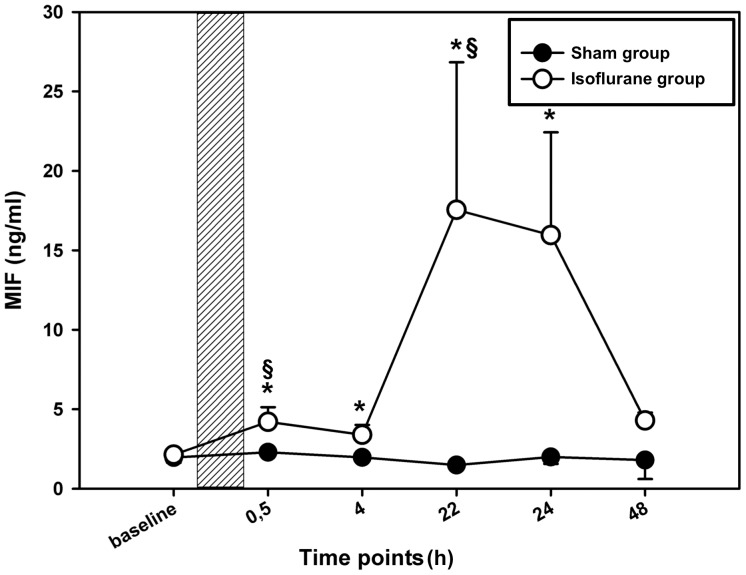
Figure 4. MIF secretion after anesthetic induced preconditioning.
Comparison of MIF secretion in the supernatant of isolated cardiomyocytes after isoflurane or control treatment. 12 days after isolation cardiomyocytes were placed in an incubation chamber and treated for 4% isoflurane or normal room air as control (sham group). At the indicated time points, cell-free supernatants were collected and MIF concentrations were measured using a modified mouse/human combination-ELISA [17]. Data represented means ± SEM of at least 3 independent experiments. The shaded area indicates duration of preconditioning. *(**) = p<0.05(0.01) vs. baseline, §(§§) = p<0.05(0.01) vs. sham group.

