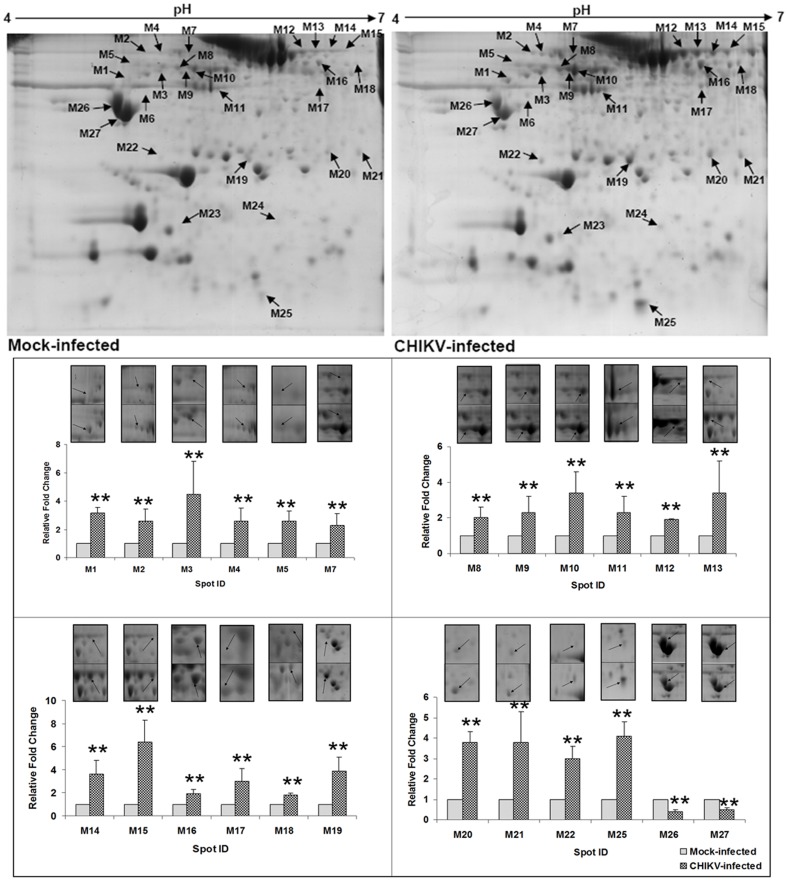
Figure 4. Representative 2-D gel image obtained from muscle tissue of mock-infected and CHIKV-infected mice.
Equal amount of protein sample (750 μg) was first separated in a linear gradient of pH 4–7, followed by separation in SDS-PAGE (12%) and coomassie staining. A total of 27 protein spots were found to be significantly altered. Fold changes (mean values± SD) of the identified proteins are illustrated graphically (** signifies p≤0.05). Spots M6, M23 and M24 were found to be affected qualitatively and hence were not presented graphically.

