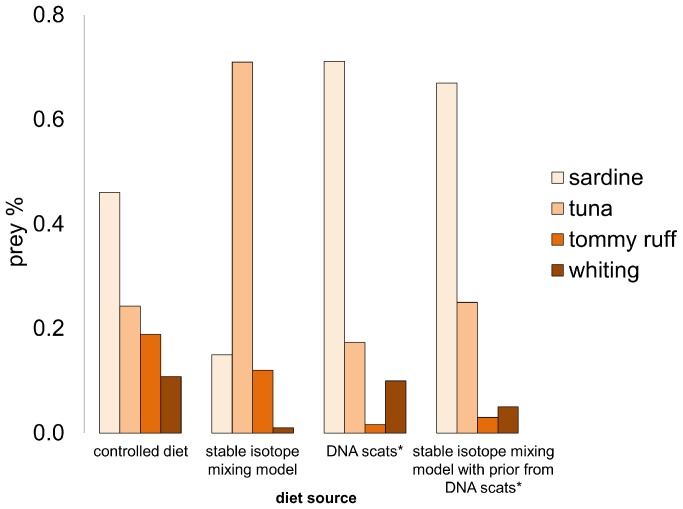
Figure 1. True proportion of prey types fed to penguins (controlled diet) and estimated proportion of these prey from different methods: mixing model [30], published information on DNA prey (*) from scats from the same experiment [29].
A posterior mixing model was run with stable isotope values using the DNA scats composition as priors [30].

