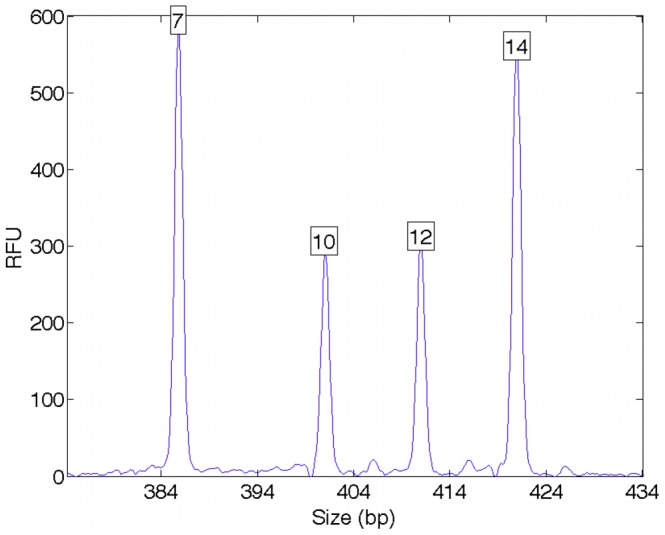
Figure 1. Mixture data.

Quantitative DNA mixture data are shown at the Penta E STR locus. The x-axis measures allele fragment size (bp), and the y-axis measures DNA quantity (RFU); a boxed peak number denotes allele length. The two contributor mixture is formed from a 7,14 major genotype and a 10,12 minor genotype. The result is a pattern of peak heights that reflect the underlying genotypes.
