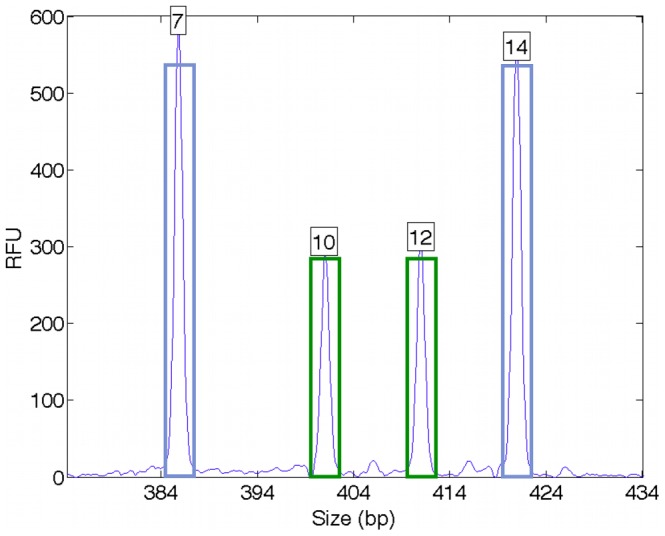
Figure 2. Genotype modeling.

Linear combinations of genotype allele pairs can explain the observed quantitative mixture data. Here, a major 7,14 contributor (blue bars) having twice the DNA as a minor 10,12 contributor (green bars) explains the data well, with a high likelihood value. Alternative genotype choices or combinations would not explain the data as well, and thus have lower likelihood.
