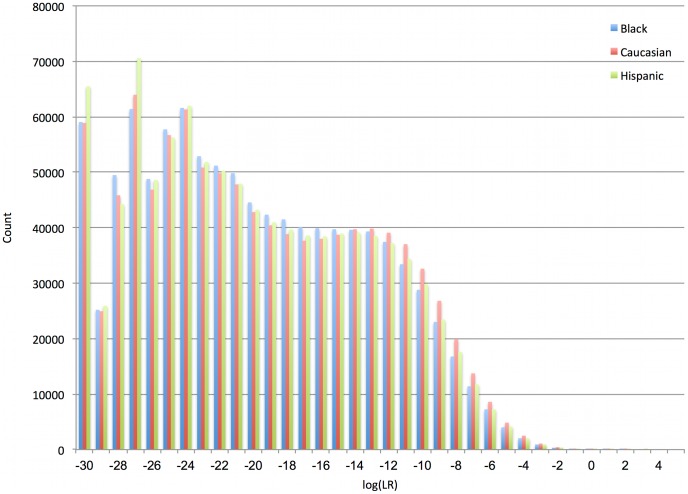
Figure 5. Computer specificity.
A histogram shows empirical log(LR) distributions for 101 evidence genotype comparisons relative to 10,000 randomly generated references. There are 1,010,000 data points for each of the three ethnic populations. Note that the negative values are located far to the left of zero.

