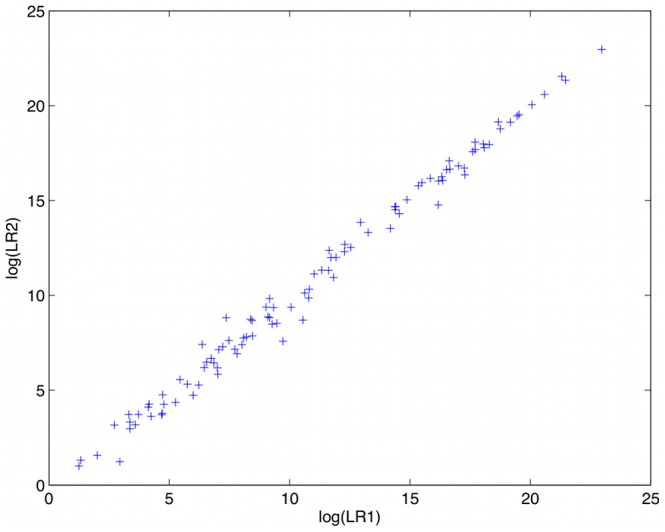
Figure 6. Computer precision.

The scatterplot shows log(LR) values for 101 duplicate computer runs on the same evidence. Each point gives the first (x) and second (y) values. The data lie close to the y = x diagonal, which represents exactly replicated results.
