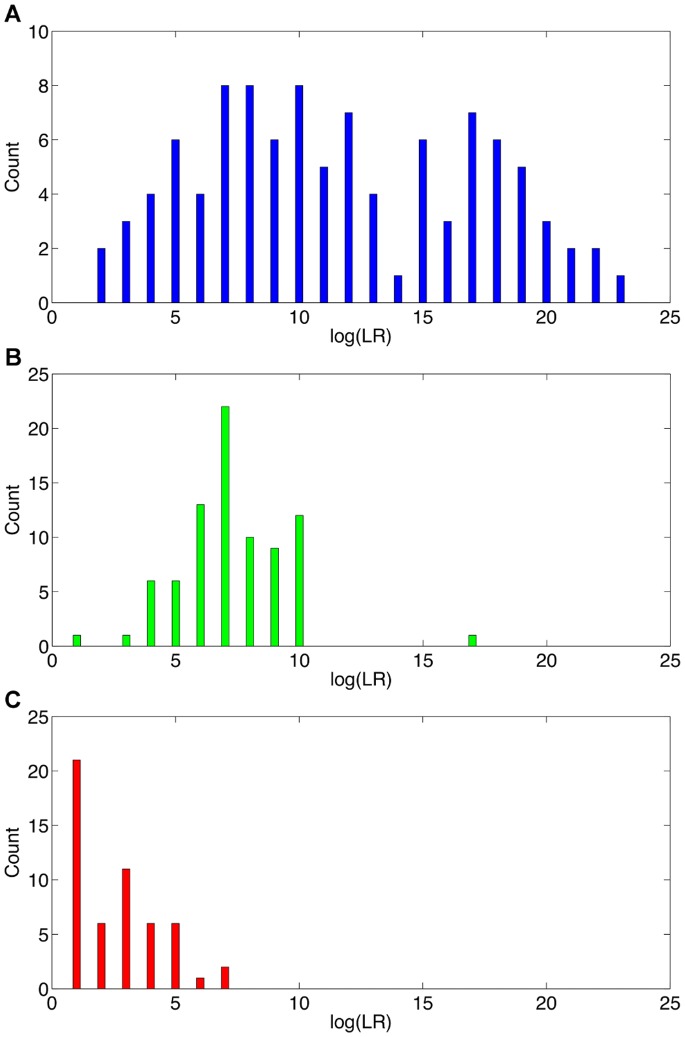
Figure 7. Method sensitivity.
Three histograms show the empirical log(LR) distribution for different mixture interpretation methods on the case data. Frequency distribution (a) shows TrueAllele inferred genotype match statistics for 101 evidence genotype matches (blue). The (b) manual CPI review yielded 81 match statistics (green) that were generally less informative (leftward) and less varied (clustered). The (c) 53 mCPI match statistics (red) gave less information and had similar values.

