
Figure 1. Interaction dedrogram.
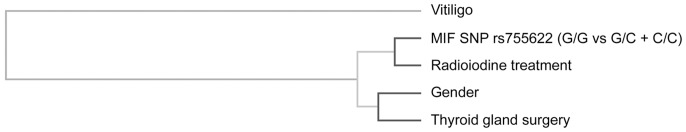
The location of the longitudinal connecting bars indicates the strength of the dependence: left is weaker and right is stronger. The hierarchical cluster analysis placed MIF SNP rs755622 genotype (GG vs GC+CC) and radioiodine treatment on the same branch, demonstrating the most strong interaction between these two factors. Gender, thyroid gland surgery and vitiligo are also included in the dendrogram as shown. MIF, macrophage migration inhibitory factor; SNP, single nucleotide polymorphism.