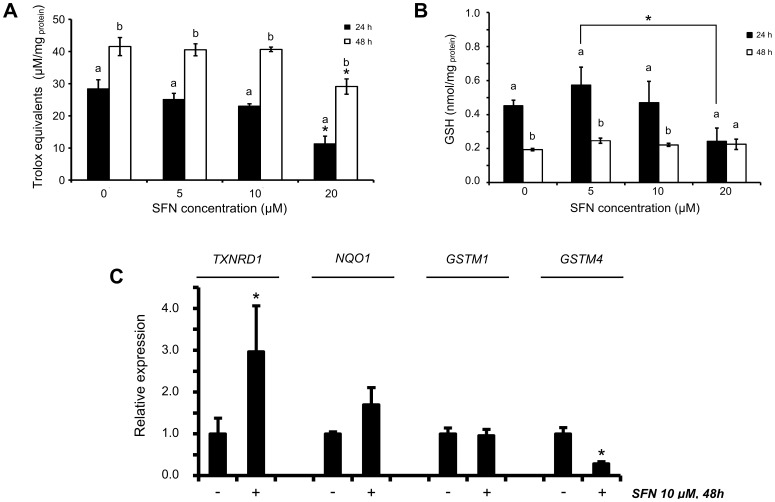
Figure 3. Antioxidant state after SFN treatment.
(A) Total antioxidant activity (TAA). TAA was determined spectrophotometrically from cell extracts incubated with ABTS reagent. Data shown are mean ± SEM (n = 3). *, significantly different between control and SFN-treated cells (p<0.05). a,b, significantly different between times (p<0.05). (B) Intracellular GSH levels for the SFN concentrations and exposure times indicated. Data shown are mean ± SEM (n = 2). *, significantly different between the indicated groups (p<0.05). a,b, significantly different between times (p<0.05). (C) Relative gene expression of selected phase 2 enzymes exposed to 10 uM SFN for 48 h. Data shown are mean ± SEM (n = 2). *, significantly different between control and SFN-treated cells (p<0.05).

