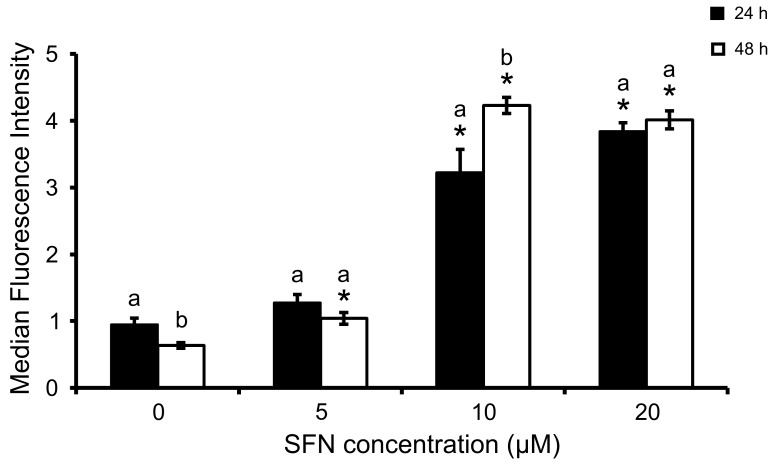
Figure 4. ROS accumulation after SFN treatment.
Cells were incubated with10 μM dichlorodihydrofluorescein diacetate and ROS accumulation was estimated from MFI by FCM. Data shown are mean ± SEM (n = 3). *, significantly different between control and SFN-treated cells (p<0.05). a,b, significantly different between times (p<0.05).

