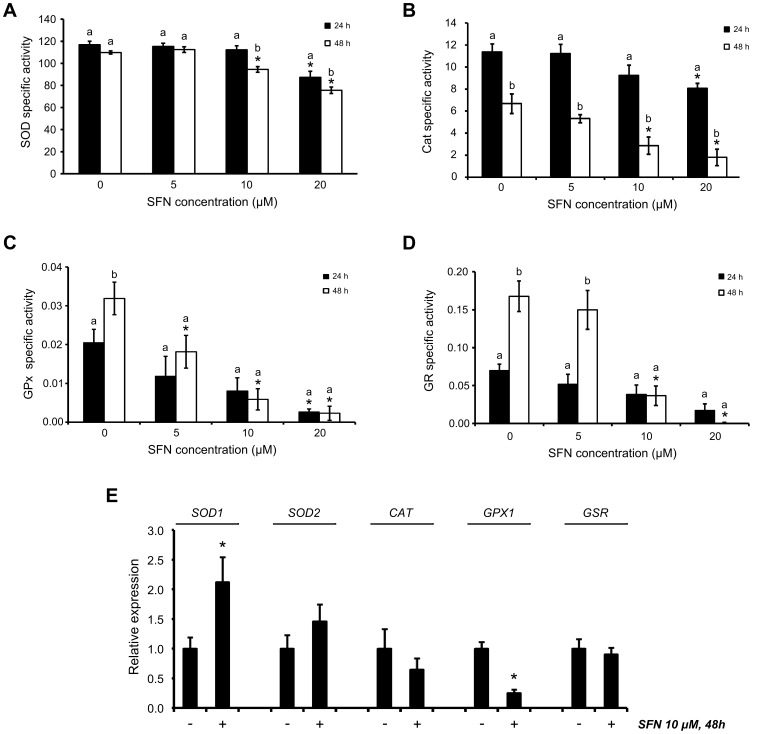
Figure 5. Effect of SFN on the activity and gene expression of selected oxidoreductases involved in ROS detoxification and GSH regeneration.
(A–D) SOD, Cat, GPx and GR specific activities, respectively. Data shown are mean in U/mg total protein ± SEM (n = 3). *, significantly different between control and SFN-treated cells (p<0.05). a,b, significantly different between times (p<0.05). (E) Relative gene expression for cells exposed to 10 μM SFN for 48 h. Data shown are mean ± SEM (n = 2). *, significantly different between control and SFN-treated cells (p<0.05).

