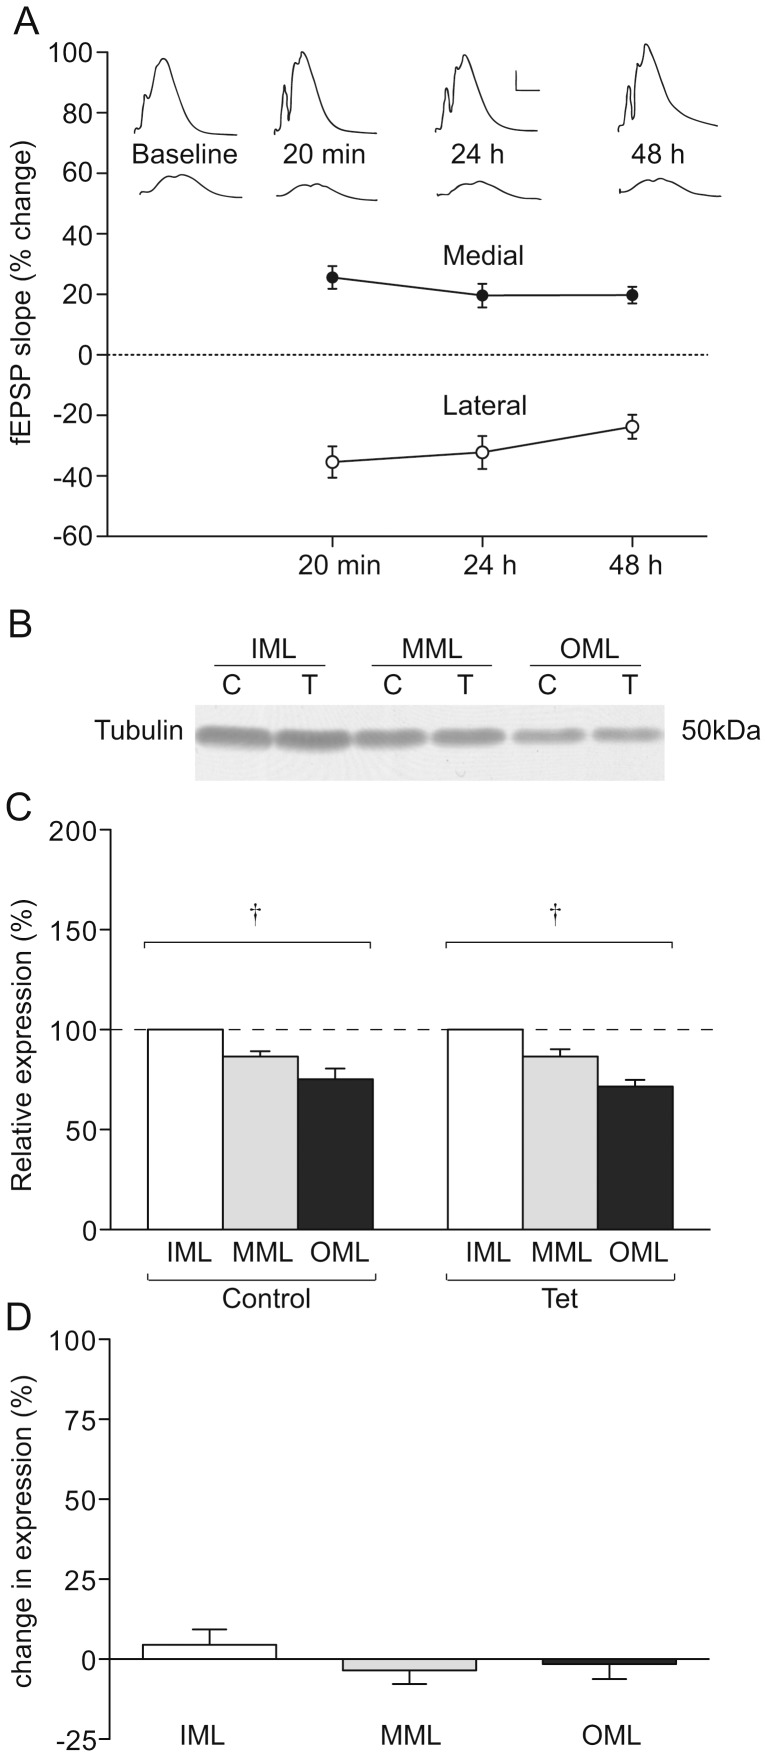
Figure 2. Tubulin expression in LTP-stimulated rats.
(a) LTP of fEPSPs in the medial perforant path synapses (MML) and heterosynaptic LTD in the lateral perforant path synapses (OML), n = 8. (b) Representative Western blot showing tubulin expression in laser microdissected tissue from one LTP-stimulated animal. (c) Mean percentage difference in expression in molecular layer zones of the LTP-stimulated hemisphere compared to the naïve hemisphere. (d) Mean relative expression of tubulin in the molecular layer zones from LTP-stimulated and naïve hemispheres, determined as a proportion of the ipsilateral inner molecular layer; † p<0.01 ANOVA.

