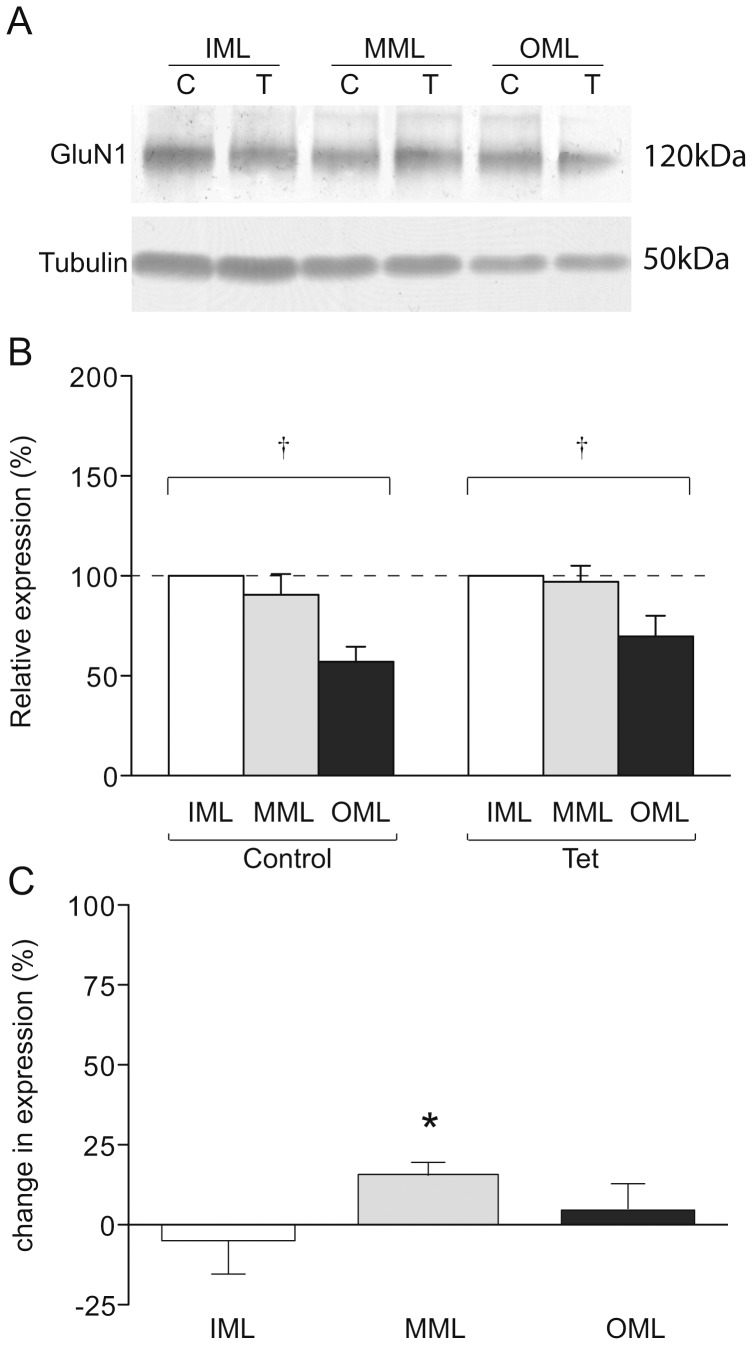
Figure 3. GluN1 expression in LTP-stimulated rats.
(a) Representative Western blot showing GluN1 (upper) and tubulin (lower) expression in laser microdissected tissue from one LTP-stimulated animal. (b) Mean relative expression of GluN1 in the molecular layer zones from LTP-stimulated and naïve hemispheres, determined as a proportion of the ipsilateral inner molecular layer. (c) Mean percentage difference in tubulin-normalised expression of GluN1 in molecular layer zones of the LTP-stimulated hemisphere compared to the naïve hemisphere; * p<0.05; † p<0.01 ANOVA.

