
Figure 5. Experiment 3 (circular motion).
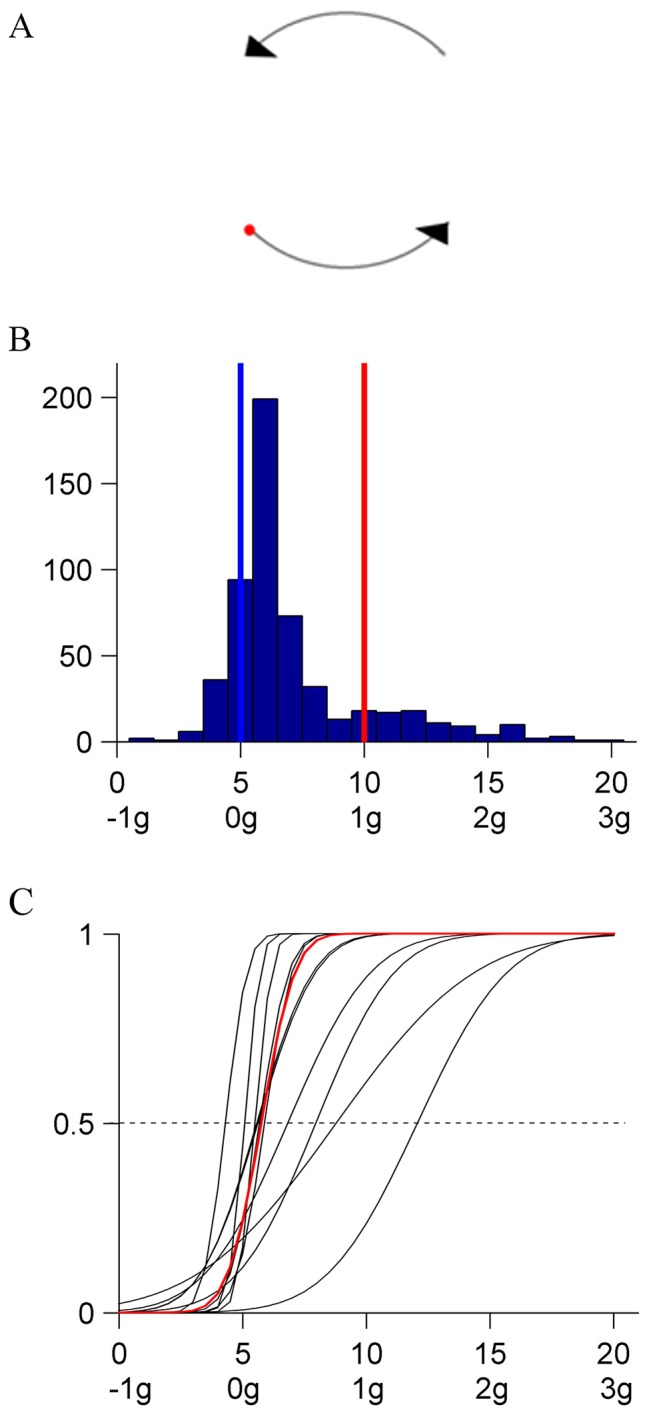
A: Schematic of target trajectory. The target moved uni-directionally, anticlockwise on a circular trajectory. The target was visible only in the bottom and top quadrants. B: Distribution histogram of the responses (pooled over participants). C: CDFs for each participant and for the population. Same format as in Figure 2B.