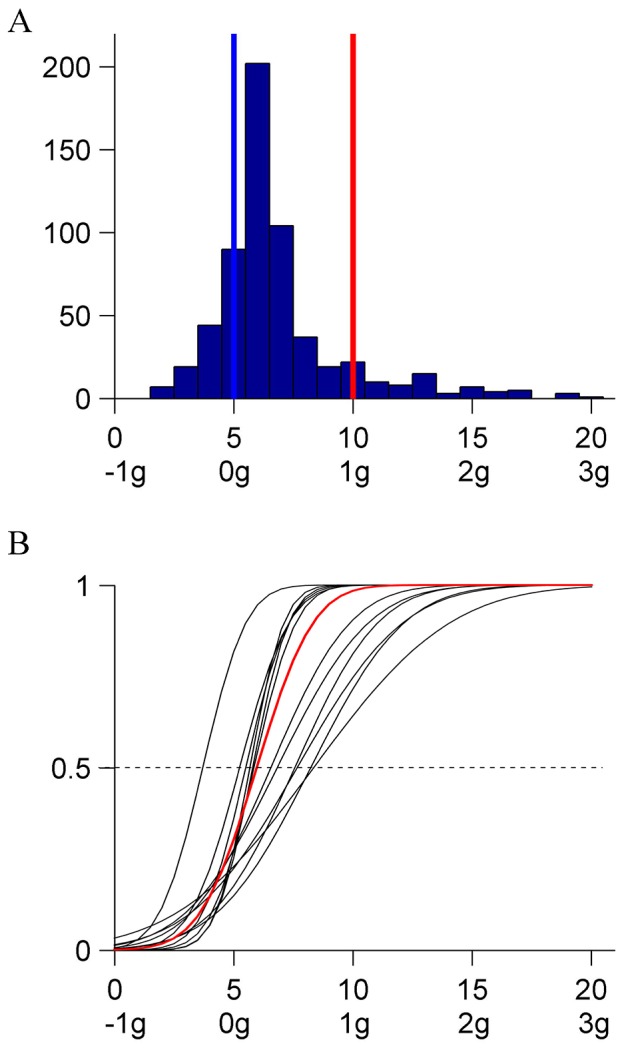
Figure 6. Experiment 4 (linear horizontal unidirectional).

A: Distribution histogram of the responses (pooled over participants). B: CDFs for each participant and for the population. Same format as in Figure 2B.

A: Distribution histogram of the responses (pooled over participants). B: CDFs for each participant and for the population. Same format as in Figure 2B.