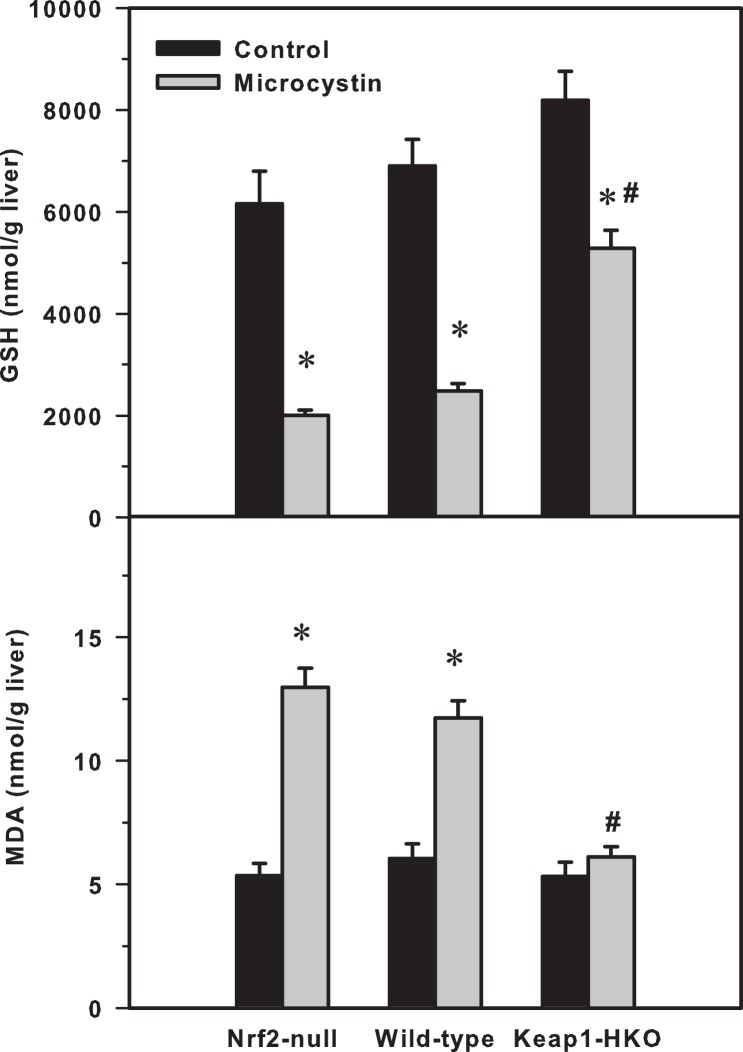
Figure 3. (Left) Hepatic glutathione concentrations (GSH), (Right) hepatic malondialdehyde (MDA) levels in Nrf2-null, wild-type and Keap1-HKO mice administered saline (10 ml/kg, i.p.) or microcystin (50 μg/kg, i.p.).
Values are expressed as mean ± S.E.M. (n = 5–8). *Significantly different from the basal level of the same genotype (p ≤ 0.05); #Significantly different from Nrf2-null mice treated with microcystin (p ≤ 0.05).

