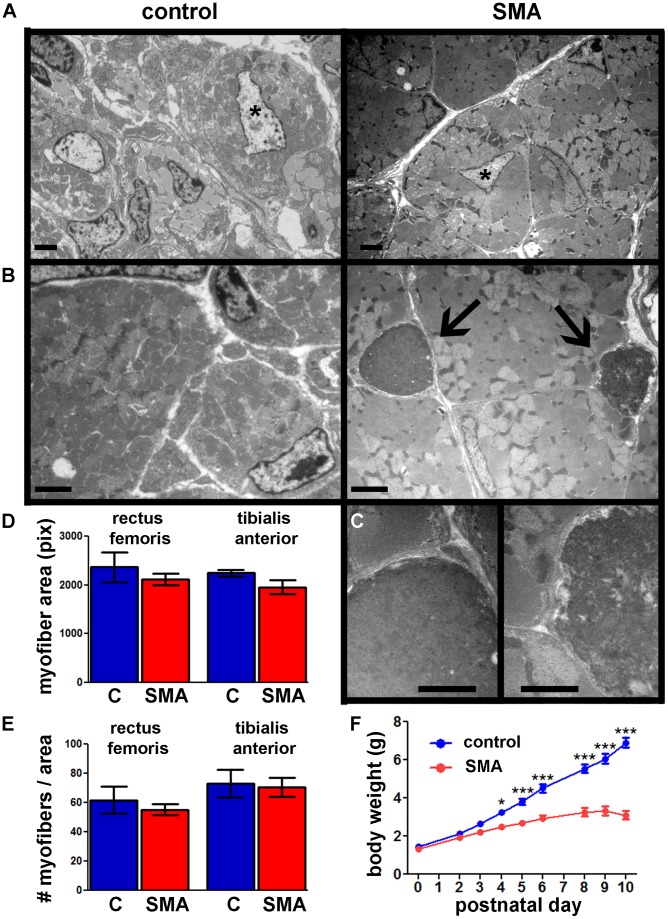
Figure 2. SMA mouse skeletal muscles exhibit apoptotic cell death in satellite cells, but normal myofiber size.
A, B, C– transmission electron microscopy images of TA muscles from SMA mice (right) and control littermates (left) at P6. A. Central nuclei (asterisk) are infrequent, but can be seen in both control and SMA muscles. Scale bar = 2 μm. B. Apoptotic satellite cell nuclei (arrows) were observed in SMA muscles, but not control muscles. Adjacent myofibers appear normal. Scale bar = 2 μm. C. Magnified images of the two apoptotic cells shown in the panel above. Cell membranes are distinct from the adjacent myofiber membranes, indicating that these dying cells are satellite cells. The apoptotic profile shown at right is at a more advanced stage of apoptosis compared to the cell at left. Nuclear condensation, membrane involution, and membrane fragmentation can be seen. Scale bar = 1 μm. D, E. Myofiber area (D) and myofiber number per muscle area (E) measurements in TA and RF muscles from SMA mice (red) and control littermates (blue) at P5 (Mean ± SE; n = 3). C = control. There were no statistically significant differences (t-test). F. Body weights of SMA mice and control littermates (Mean ± SE; n = 4–5). Statistical significance between SMA and control (two-way repeated measures ANOVA, Bonferroni test): * p<0.05, ** p<0.01, *** p<0.001.

