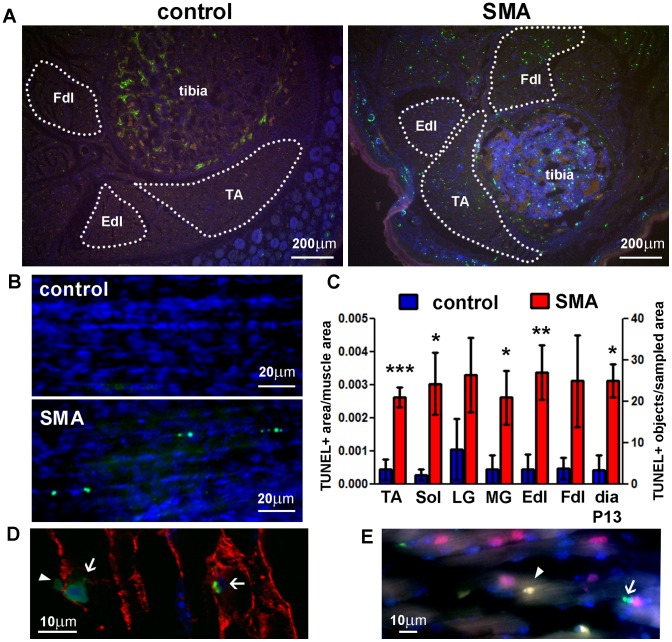
Figure 3. Cell death in SMA mouse skeletal muscle at postnatal days 5 and 13.
A, B. TUNEL (green) was performed on transverse sections of the lower hindlimb at P5 (A) and whole diaphragms at P13 (B). Hoechst (blue) was used to stain cell nuclei. The red channel was used to exclude autofluorescent cells (e.g. red blood cells) from analysis. Dotted lines delineate the muscle areas quantified. C. TUNEL-positive counts in lower hindlimb skeletal muscles and diaphragm (Mean ± SE; n = 5–6 for hindlimb, n = 2 for diaphragm). TA – tibialis anterior muscle, Fdl/Edl – flexor/extensor digitorum longus muscle, Sol – soleus muscle, LG – gastrocnemius lateralis muscle, MG – gastrocnemius medialis muscle, dia – diaphragm. Statistical significance between SMA and control for each muscle group (one-tailed t-test): * p<0.05, ** p<0.01, *** p<0.001. Micrographs of additional hindlimb muscle groups are shown in Figure S1. TUNEL-positive objects per muscle area are shown for diaphragm; TUNEL-positive area per muscle area is shown for all other muscles. D. Confocal immunofluorescent image of hindlimb skeletal muscle at P5; green – TUNEL, red – laminin (myofiber cell membrane marker), blue – nuclei. E. Conventional immunofluorescent image of hindlimb skeletal muscle at P5; green – TUNEL, red – Pax7 (satellite cell marker), blue – nuclei. Arrows – myotube nuclei, arrowheads – satellite cell nuclei.

