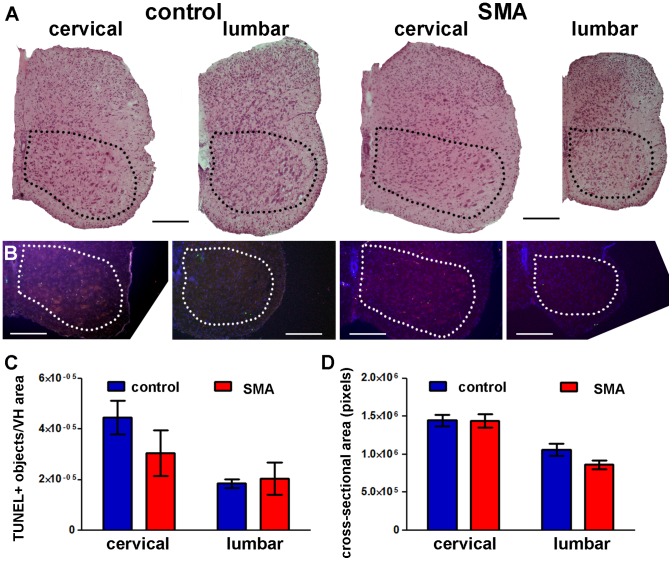
Figure 5. Cell death in P5 SMA mouse spinal cord is not increased significantly.
A. Representative images of H&E-stained transverse sections at P5 showing cervical and lumbar levels of spinal cord from control (left) and SMA (right) littermates. B. TUNEL (green) was performed on transverse whole body sections at P5. Hoechst (blue) was used to stain cell nuclei. A separate channel (red) was used to identify anatomical landmarks and exclude autofluorescent signal (e.g. red blood cells). A and B: dotted lines delineate the ventral horn (VH) areas analyzed; all scale bars = 200 μm. C. TUNEL-positive counts in the VH of spinal cord at lumbar and cervical levels (Mean ± SE; n = 4–6). D. Cross-sectional area of spinal cord at lumbar and cervical levels (Mean ± SE; n = 3–6). There were no statistically significant differences between SMA and control groups (one-tailed t-test).

