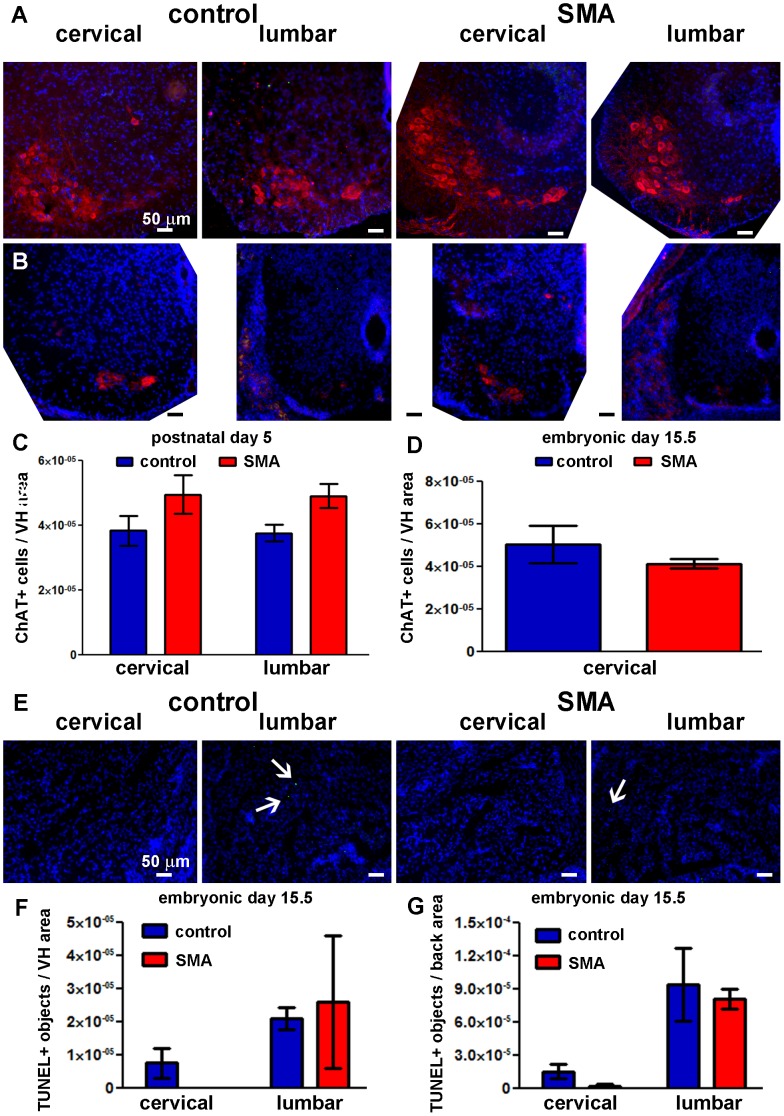
Figure 6. No significant motor neuron loss in spinal cord at E15.5 or P5 in SMA mice.
A, B, C. TUNEL (green), ChAT immunostaining (red), and nuclear staining (blue) were performed on transverse whole body sections at E15.5 (B) and isolated spinal cord sections at P5 (A). Representative images of lumbar and cervical spinal cord are shown for the control (left) and SMA (right) mouse groups. Scale bar = 50 μm in all panels. C, D. ChAT-positive motor neuron counts in the VH of spinal cord at lumbar and cervical levels at P5 (C; Mean ± SE; n = 4–5) and cervical level at E15.5 (D; Mean ± SD; n = 2 (SMA), n = 4 (control)). E. TUNEL (green) and nuclear staining (blue) were performed on transverse whole body sections at E15.5. Representative images of lumbar and cervical ES back muscles are shown for the control (left) and SMA (right) littermates. Scale bar = 50 μm in all panels. Arrows denote TUNEL-positive nuclei. F, G. TUNEL-positive structure counts in spinal cord VH (F) and ES muscle (G) at lumbar and cervical levels at E15.5 (Mean ± SD; n = 2 (SMA), n = 4 (control)). There were no statistically significant differences between SMA and control groups (two-tailed t-test).

