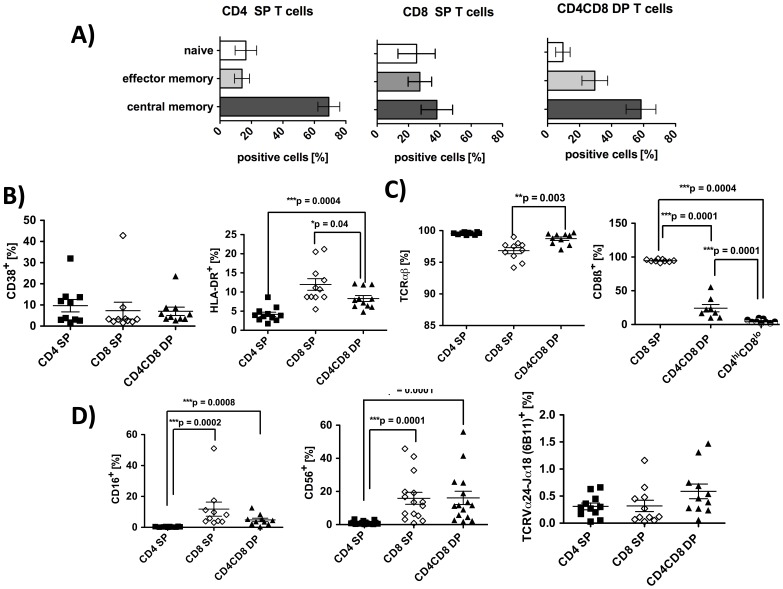
Figure 2. Phenotypic characterization of CD4CD8 DP T cells in RA patients.
PBMC from RA patients were isolated and FACS analyses from live cells were performed (PI staining used for exclusion of dead cells). CD3 pregated cells were further gated on CD4 single, CD8 single and on CD4CD8 double positive T cells. A) Distribution of CD45RO−CCR7+ (naive) CD45RO+CCR7− (effector memory) and CD45RO+CCR7+ (central memory) cells in the cell populations indicated. n = 5 5 B) Percentage of T cells positive for CD38 (n = 10) and HLA-DR (n = 11). C) Percentage of cells bearing a TCR alpha-beta (n = 10) and cells positive for CD8β (n = 9) in the T cell populations indicated. (D) Percentage of cells positive for CD16 (n = 10), CD56 (n = 15) and for TCRVα24-Jα18 (n = 11, marker for iNKT) in the T cell populations indicated. In all graphs, lines represent means and SEM. Significance as given, *p<0.05, **p<0.01, ***p<0.001.

