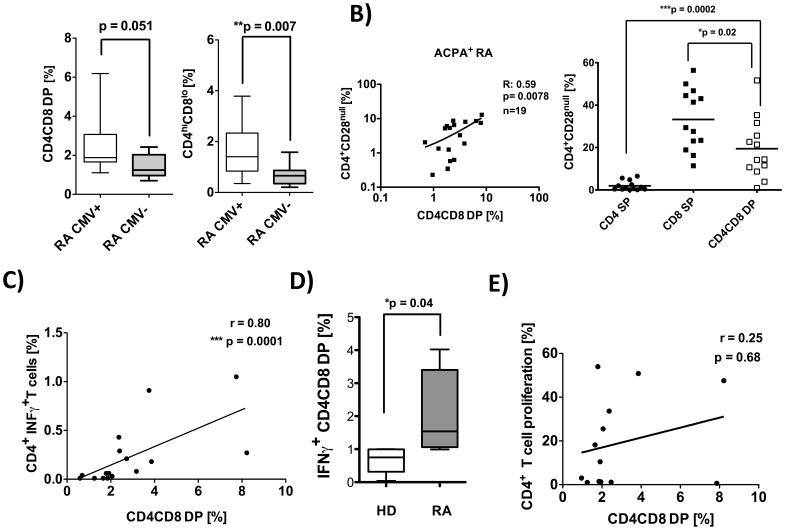
Figure 6. Frequencies of CD4CD8 double positive T cells are increased in CMV positive RA patients and correlate with CMV specific INFγ producers.
A) PBMC were isolated from CMV+ RA patients (n = 28) and CMV− RA patients (n = 12) and analyzed by flow cytometry using anti-CD19, anti-CD3, anti-CD4 and anti-CD8 monoclonal antibodies (PI staining used for exclusion of dead cells). B) Correlation of the frequency of total double positive T cells with CD4+CD28null T cells in ACPA+ RA patients (left graph) and comparison of frequencies of CD28null cells among CD4 SP, CD8 SP and total DP T cells (right graph). C–D) PBMCs were restimulated with CMV-lysate for 4 hrs in vitro. Subsequently, an INFγ specific secretion assay was performed and cells were counterstained with aCD3, aCD4 and aCD8. Flow cytometric cytokine analyses were performed on live cells (PI staining used for exclusion of dead cells) pre-gated on CD3+ T cells. C) Depicted is the correlation of CMV specific INFγ producing CD4 T cells with the frequencies of CD4CD8 DP cells from the same donor (n = 16). D) CMV specific INFγ producing CD4CD8 DP T cells from RA (n = 5) and HD (n = 5) are shown. E) PBMCs were labeled with CFDA-SE and restimulated with CMV-lysat (n = 13) for 7 d in vitro. Depicted is the correlation of CMV specific CD4 T cell proliferation with the frequencies of CD4CD8 DP cells from the same donor. Presented box plots show median, interquartile range, and 10–90 percentiles. Significance as given, *p<0.05, **p<0.01, ***p<0.001.

