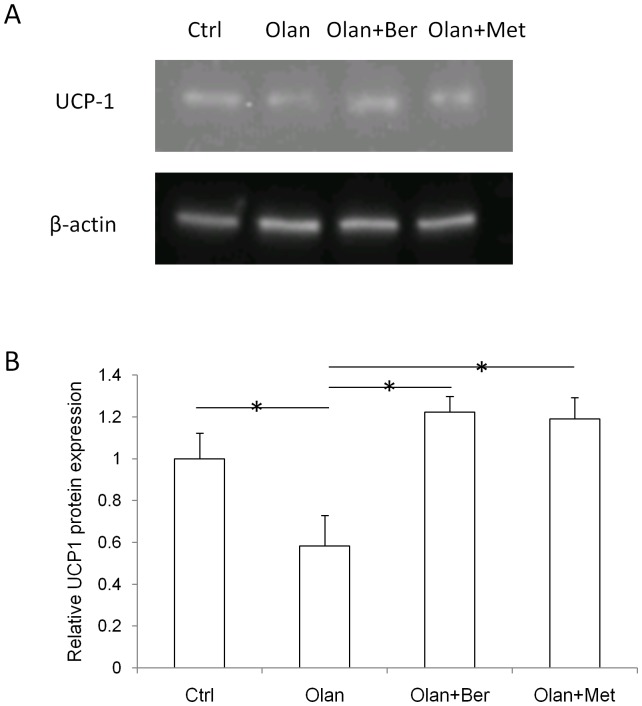
Figure 2. UCP-1 and β-actin protein expression in each treatment group (vehicle, olanzapine, olanzapine + berberine, olanzapine + metformin) (A).
Quantification of relative protein expression of UCP-1 to β-actin, when normalized with the control group (B). * denotes significant difference at P<0.05.

