Figure 1.

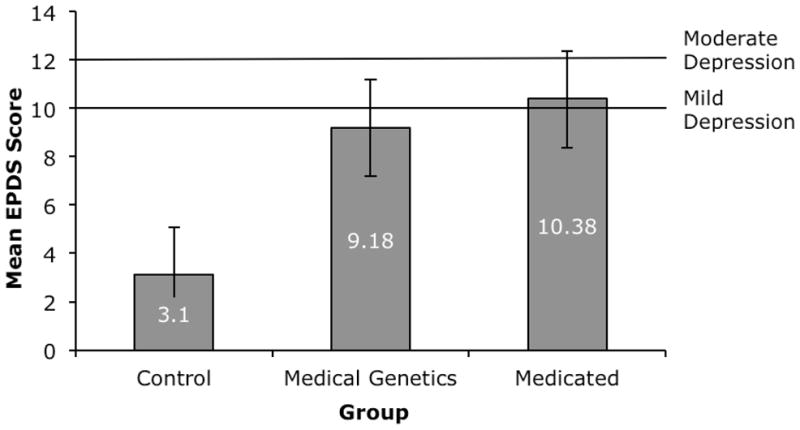
Mean score on the EPDS (+SE) for the Control group (n=41), the MG group (n=80), and the MEDS group (n=42), with lines illustrating cut-off scores for mild depression (10) and moderate depression (12).

Mean score on the EPDS (+SE) for the Control group (n=41), the MG group (n=80), and the MEDS group (n=42), with lines illustrating cut-off scores for mild depression (10) and moderate depression (12).