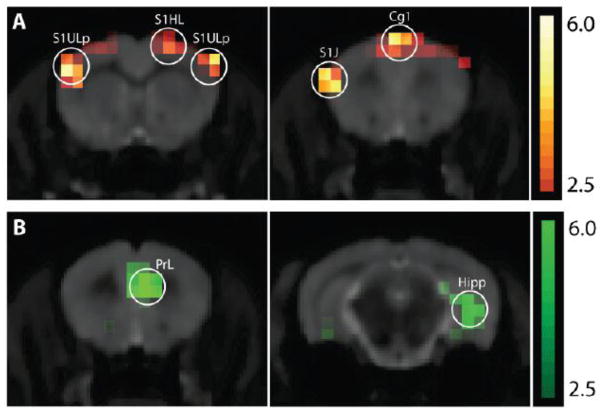
Figure 4.
Coronal slices of t-stat map contrasting formalin- to saline-injected rats, t > 2.5 shown, overlaid on size matched anatomical magnetic resonance imaging (MRI). (A) Formalin > control with scale shown for t-values 2.5 to 6.0 in orange. (B) Control > formalin with scale shown for t-values 2.5 to 6.0 in green.

