Figure 2.
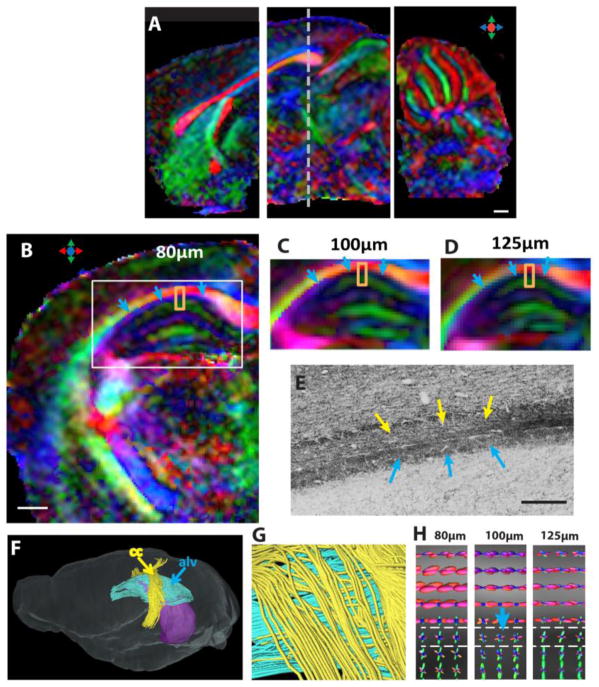
High spatial resolution diffusion MRI of the live mouse brain. A: Sagittal views of the DTI colormaps taken from the anterior, middle, and posterior FOEs used in this study. B–D: Axial direction-encoded colormaps of the hippocampus at 80 μm, 100 μm, and 125 μm isotropic resolutions, respectively. The axial location of these images is indicated by the dashed line in A. E: A Pan-Neurofilament-stained section that shows the alveus (alv) of the hippocampus (indicated by the blue arrows) and the corpus callosum (indicated by the yellow arrows). F–G: Fiber-tracking results at 80 μm isotropic resolution, where the corpus callosum fibers (yellow) and the alv fibers (blue) can be separated. The purple shading in F indicates the position of hippocampus. H: The fiber orientation distribution (FOD) maps of the selected regions (orange squares in B–D) at three resolutions. Scale bars in A and B are 500 μm, and the scale bar in E is 200 μm.

