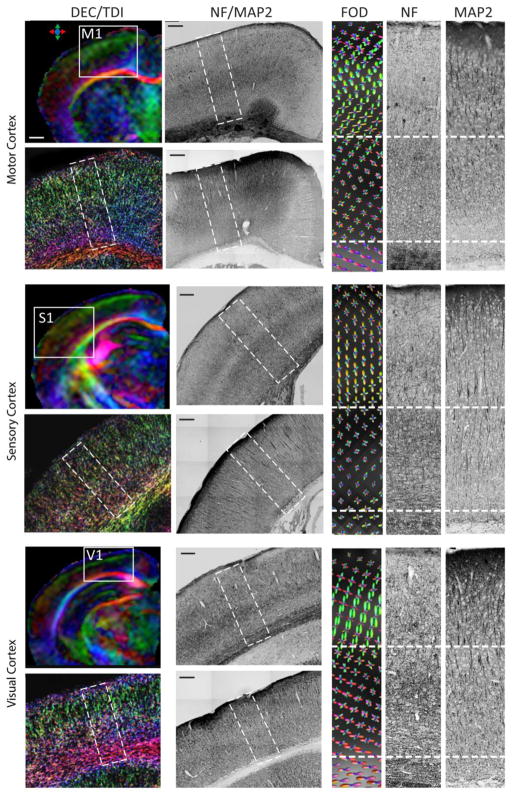
Figure 5.
In vivo HARDI of the mouse motor (M1), sensory (S1), and visual (V1) cortices and corresponding neurofilament (NF) and microtubule-associated protein 2 (MAP2)-stained sections. Images in the left-most column are DTI colormaps of localized anterior / middle / posterior mouse brain FOEs and high-resolution TDI maps of the M1 / S1 / V1 cortices in selected areas, as indicated on the colormaps. The right-most three columns show FOD maps estimated from the HARDI data from each cortex and matching NF- and MAP2-stained sections. The regions shown in the FOD maps are indicated by the dashed rectangular boxes in the NF and MAP2 sections. The dashed lines in the rightmost three columns separate the cortex into outer and inner layers. Scale bar in A is 500 μm, and all the other scale bars are 200 μm.

