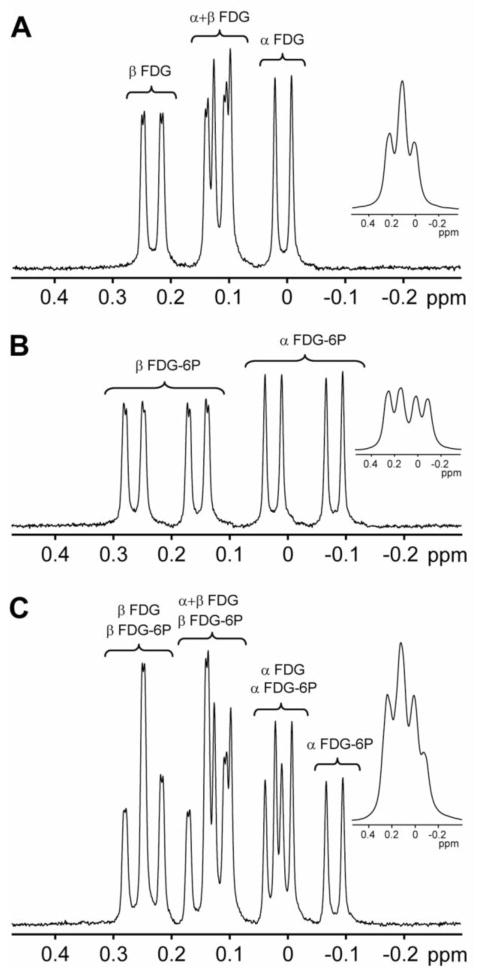
Figure 1. 19F NMR of FDG and FDG-6P.
The 19F spectra of 5mM FDG (A), 5mM FDG-6P (B) and a sample containing 5mM of both FDG and FDG-6P (C) acquired at 11.7T and 35 °C. The insets represent the same spectra obtained using 25Hz exponential apodization of the original FID. Apodization of the in vitro FID by 25Hz results in a similar 19F spectrum as for in vivo situation (where the intrinsic line-broadening was estimated to be 25Hz). The result of the apodization is the collapse of the 19F resonances into 3 signals for FDG (A, inset) and 4 signals for FDG-6P (B, inset) and FDG/FDG-6P (C, inset) samples. Because there is no other 19F signal in the spectra except those of FDG and FDG-6P, the 0ppm reference was assigned to transmitter frequency.

