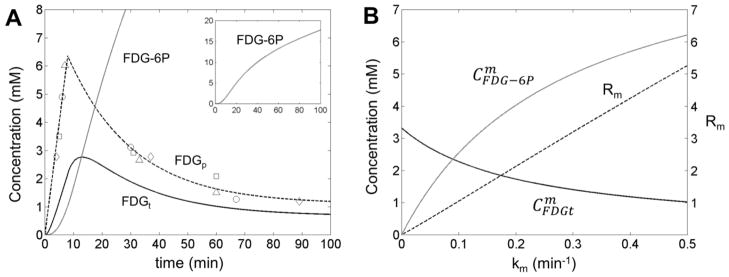
Figure 5. Determination of metabolic rate of FDG consumption in rat brain.

The time dependence of FDG in plasma (FDGp, open symbols), combined with the ratio R between FDG-6P and FDG 19F signals measured in each CSI voxel, can be used to calculate the FDG and FDG-6P concentrations in the brain tissue (A). The metabolic model is based on a reversible transport between plasma and tissue plus a non-saturable plasma to tissue contribution. The model includes also the conversion of FDG to FDG-6P, described by the metabolic rate km. The time dependence of the FDGp was assumed linear for the entire duration of the FDG infusion (8 minutes) followed by an exponential decay of the FDG in the plasma after FDG infusion was stopped. The average FDGt and FDG-6P concentrations, and were calculated by integration of time-dependent FDGt and FDG-6P concentrations according to Eq. (23), for various km values between 0 to 0.5 min−1 (B). The ratio Rm was calculated for various km values and shows a strong linear dependence on km (B, dashed line) with a slope SR= 10.596 ± 0.002 min. This linear dependence can be used to calculate the km value in each CSI voxel using the experimentally measured ratio R. As an example for the central (boxed) voxel shown in Fig. 4A, the ratio R is 1.48, which corresponds to a metabolic rate constant km= 0.14 min−1. The time dependencies for FDG and FDG-6P concentrations in the brain tissue for this voxel are shown in (A) with continuous black and gray lines, respectively. The various open symbols in (A) correspond to blood samples extracted from different animals. The scale for R is shown on the right side of Figure 5B.
