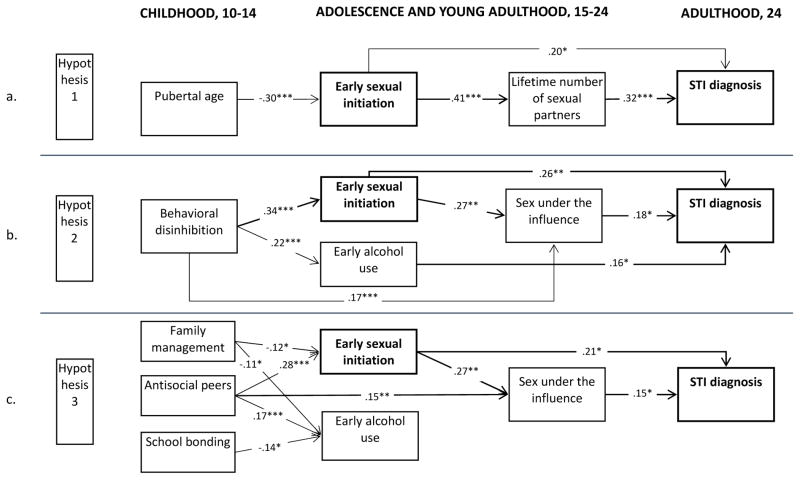
Figure 1. Models testing Hypotheses 1–3 in SSDP dataset.
Note. *p < .05, **p < .01, ***p < .001. Coefficients in the models are partial standardized betas. All models are saturated, such that all dependent variables are regressed onto all model predictors. Where lines are not drawn, the relationships are nonsignificant at p < .05 level. All variables controlled for gender, childhood SES, ethnicity, and being the child of a teen parent. In Figure 1c, correlations between Family management (A), Antisocial peers (B), and School bonding (C) are as follows: AB = −.29***, BC = −.22***, AC = .36***.

