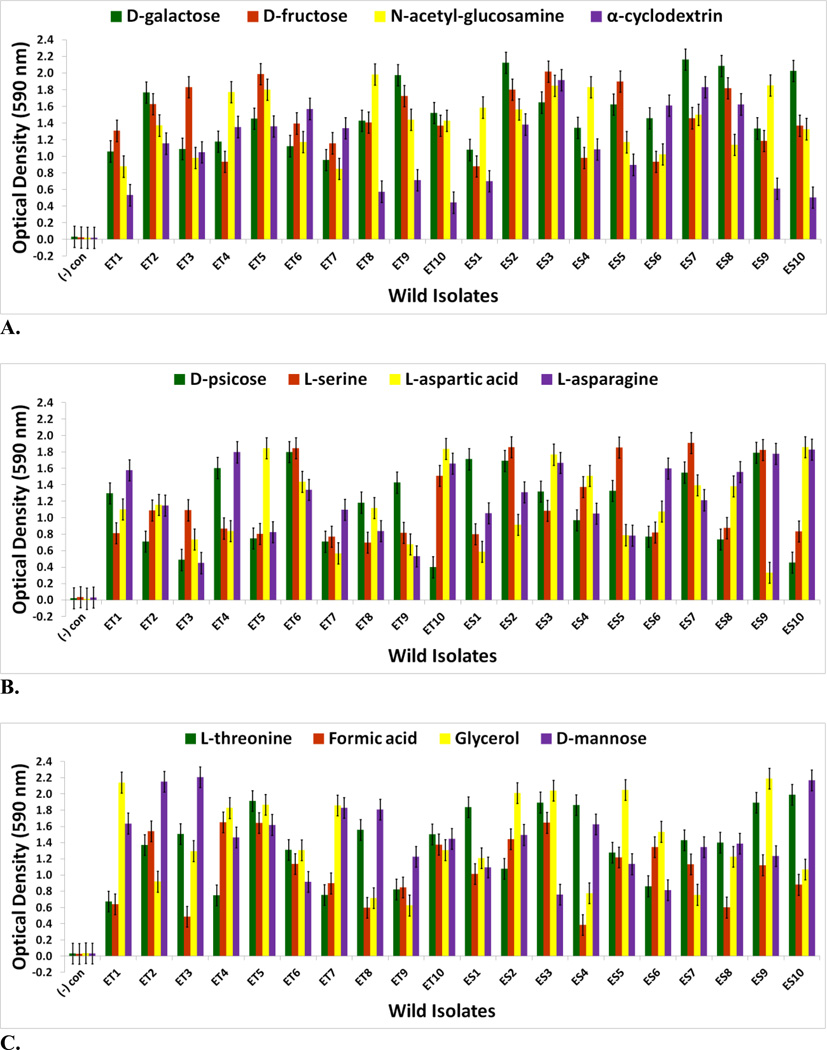
FIGURE 3.
Optical density (590 nm) measurements in (A) D-galactose, D-fructose, N-acetyl-D-glucosamine, and α-cyclodextrin (B) D-psicose, L-serine, L-aspartic acid, and L-asparagine (C) L-threonine, formic acid, glycerol, and D-mannose of wild V. fischeri isolates from E. tasmanica (“ET”) and E. scolopes (“ES”) specimens collected from the field (n=3). Error bars represent Fisher LSDs with Bonferroni correction for multiple pairwise comparisons (type I experimentwise error rate α=0.05). If error bars overlap between any particular pair of comparisons, they are not significantly different from each other [28].

