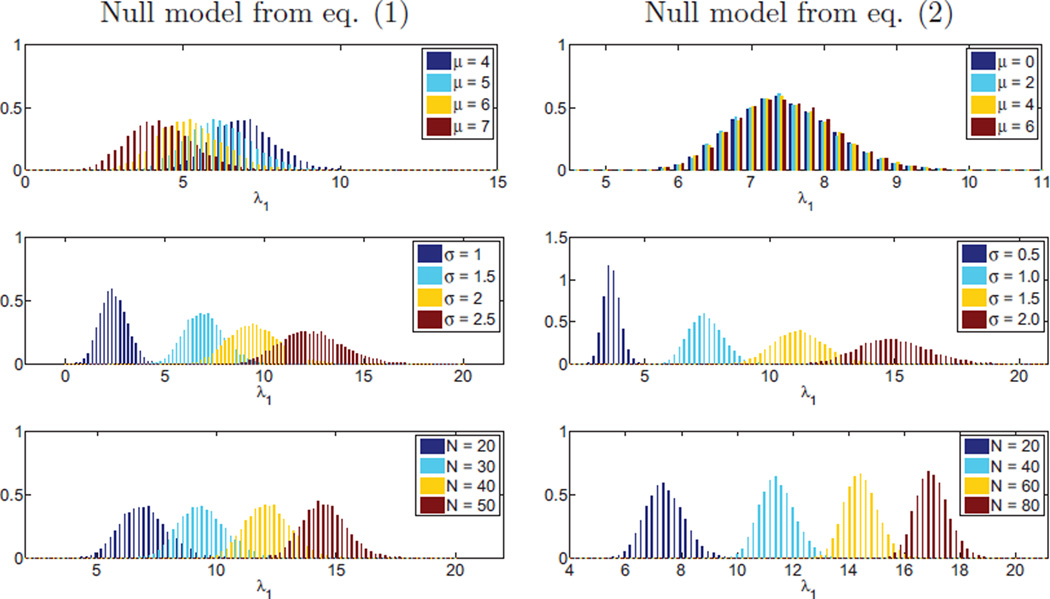
Figure 2.
Distribution of the largest eigenvalue of BRandom over several network parameters. Left column: using the conventional definition of modularity, the distribution depends on the network size and the edge mean and standard deviation; right column: using our null model for the definition of modularity, the distribution becomes invariant to the edge mean.

