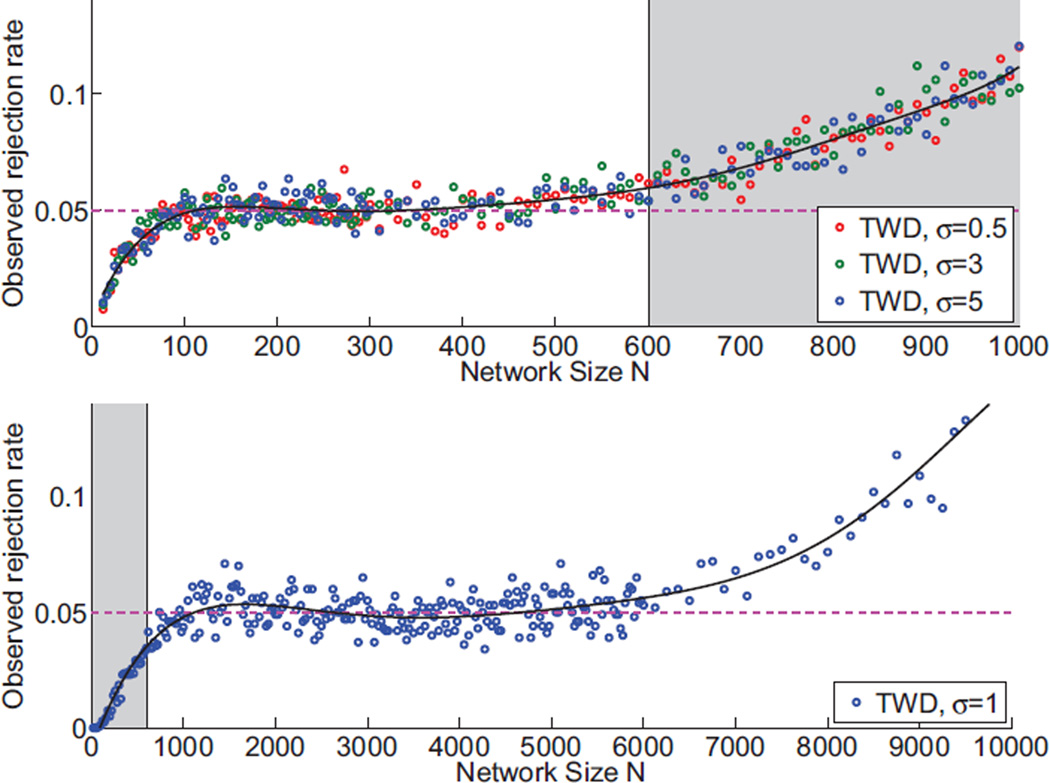
Figure 6.
Specificity of our statistical significance testing method based on the Tracy-Widom distribution (equation (6)). Plots show the observed null hypothesis rejection rate, when the nominal rate is α=5%. Solid lines indicate a polynomial fit across the measured scattered points. We suggest applying different sets of parameters with the boundary N = 600. Top panel shows the specificity for small networks and lower panel the specificity for large networks. Gray background indicates the specificity when our formulas are applied outside the suggested range. Notice, specificity does not depend on edge standard deviation.

