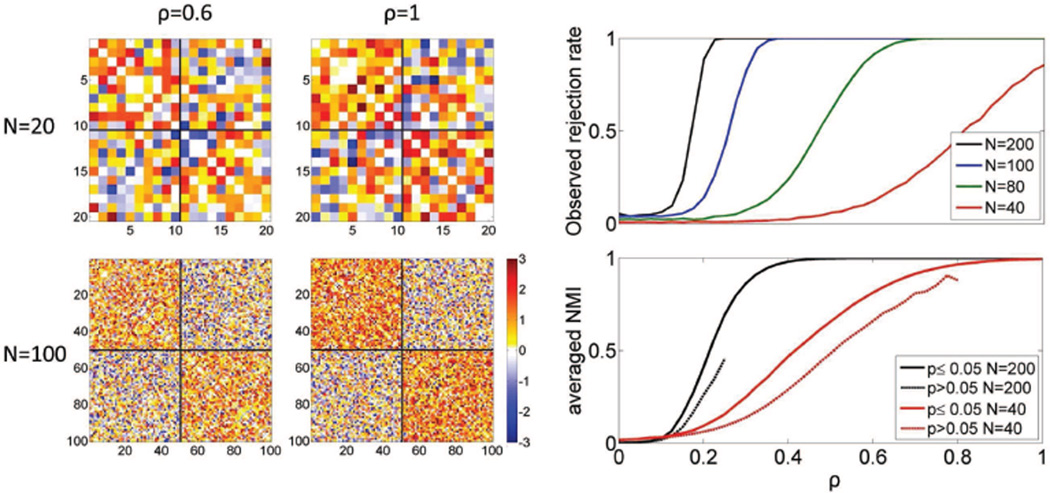
Figure 8.
(Left) Realizations of structured networks of size N = 20 and N = 100, with weights ρ = 0.6 and ρ = 1.(Top right) Rejection rate of the significance test on gradually introduced structured networks controlled by parameter ρ. (Bottom right) The averaged NMI of each clustering result against the true structure for p ≤ 0.05 and p > 0.05 for network size N = 40 and N = 200, respectively.

