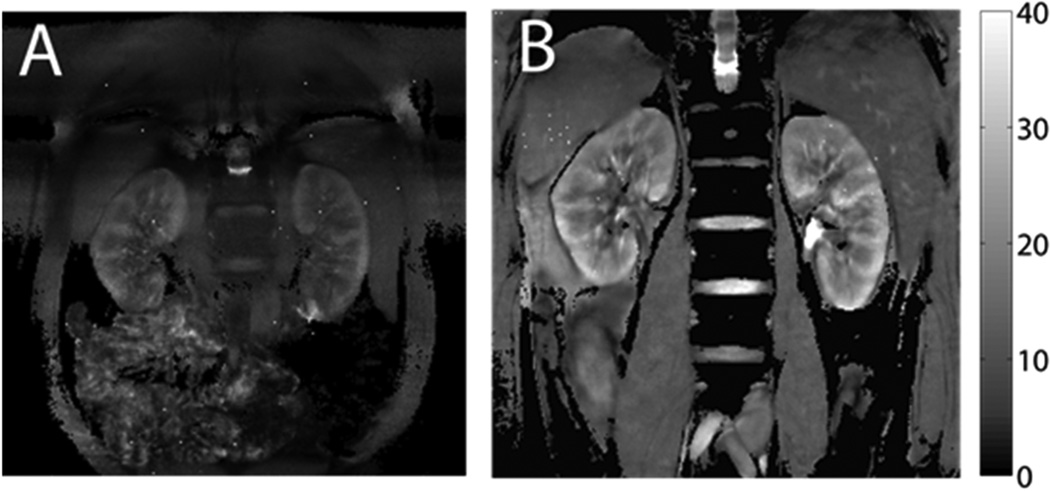
Figure 2.
Kidney T2* maps from BOLD imaging. The scale on the right side is T2* value, with unit of milliseconds. Higher T2* corresponds to lower deoxyhemoglobin concentration. A) Typical T2* map with conventional BOLD scan (20-sec breath-hold, matrix size 256 × 256, FOV 32 × 32 cm). B) T2* map with free-breathing prospectively navigated sequence (10-minute imaging time, matrix size 512 × 512, FOV 50 × 50 cm). The free-breathing images offer greater image quality.

