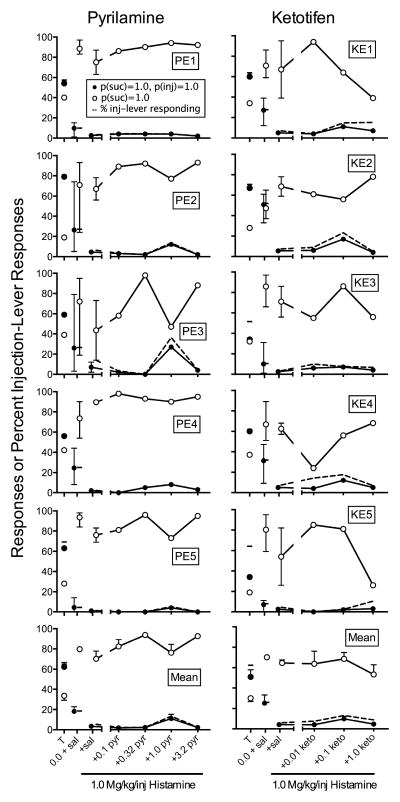
Fig. 5.
The y-axis shows responses on the sucrose (suc) plus injection (inj) (filled circles) and sucrose-alone (open circles) levers during the final choice-training session (T), and as a function of saline (sal) and pretreatment dose for the Pyrilamine (left column) and Ketotifen (right column) rats with the equal-reinforcement procedure in Experiment 2. Dashes and dashed lines indicate percent sucrose-plus-injection-lever responding. Error bars are ranges for individual subjects and SEM for means.

