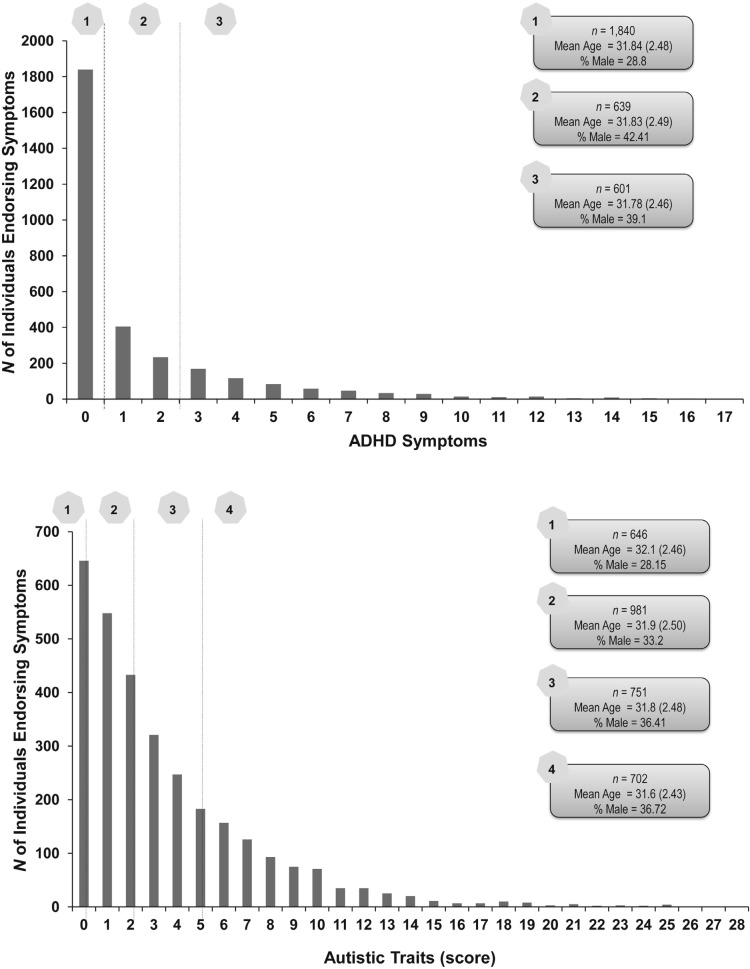
Figure 1.
Distribution of attention-deficit/hyperactivity disorder (ADHD) symptoms (Figure 1a) and autistic traits scores (Figure 1b). ADHD (Figure 1a) categories are defined by endorsement of no symptoms (1), one to two symptoms (2), and three or more symptoms (3). Autistic traits categories (Figure 1b) are defined by endorsement of DSM-IV–related autistic traits on a self-report measure with scores as follows: score of 0 (1), score of 1–2 (2), score of 3–5 (3), and score of 6 or higher (4). Also shown in the figure are mean (standard deviation) age in years and proportion of men in each category.

