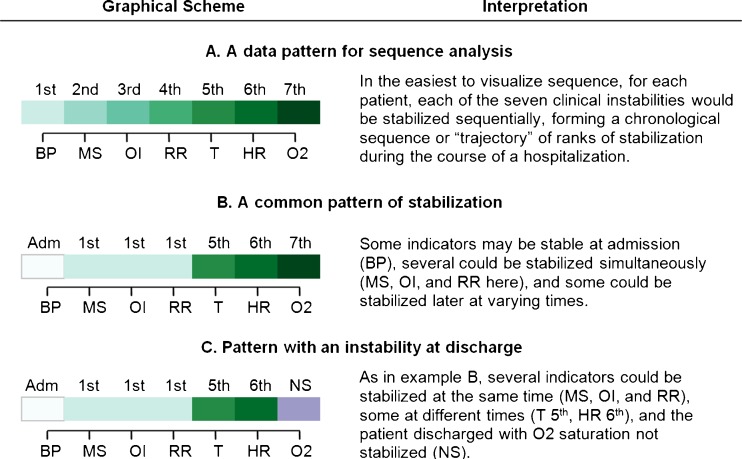
Figure 1.
Basic sequential patterns of stabilization of discharge criteria. This figure shows the graphical scheme used in subsequent figures, with different shades of color assigned to the orders of stabilization, panel A. The rank order of stabilization is shown in a left to right sequence corresponding to the order in which each indicator is stabilized. The order displayed here and in subsequent graphics (BP = blood pressure; MS = return to baseline mental status; OI = ability to feed by oral intake; RR = respiratory rate; T = temperature; HR = heart rate; O2 = Blood oxygen saturation) corresponds to the overall average resolution pattern in our data, so this “baseline” order is adopted for convenience. Several indicators can have the same rank, since multiple indicators can be recorded as stabilized at the same observation point. For example, in panel B, three indicators were stabilized at observation point 1, so they were all ranked “1st.” Varying shades of green = stabilized nth or tied for nth. In addition to the instability resolution coding, we added three additional codes to our data and graphical displays: White = Indicator stable at admission; Purple = Indicator not stabilized before discharge; Orange = Patient died in-hospital before indicator stabilized.

