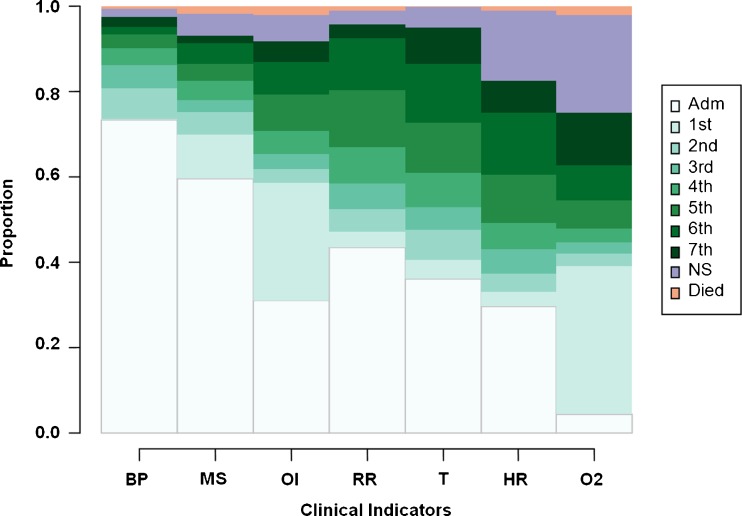
Figure 2.
Proportional distributions of the rank order of indicator stabilizations ( N = 1,326). This figure shows the proportional distributions of the rank orders of indicator stabilization as stacked bars, with different shades of color assigned to each order of stabilization. For example, the white bars show that the BP and MS instabilities were most often (73 % and 59 %, respectively) already recorded as stable at admission. The palest green bars show that the OI and O2 instabilities were most often (28 % and 35 %, respectively) resolved first or tied for first in rank order of resolution of all seven instabilities. The darkest green portion of the O2 saturation instability shows that O2 was resolved last (or 7th) for about 13 % of patients, and the purple portion shows that it remained unstable on discharge for about 23 % of patients. White = indicator stable at admission; Varying shades of green = stabilized nth or tied for nth; Purple = Indicator not stabilized before discharge; Orange = Patient died in-hospital before indicator stabilized. BP = blood pressure; MS = return to baseline mental status; OI = ability to feed by oral intake; RR = respiratory rate; T = temperature; HR = heart rate; O2 = Blood oxygen saturation.

