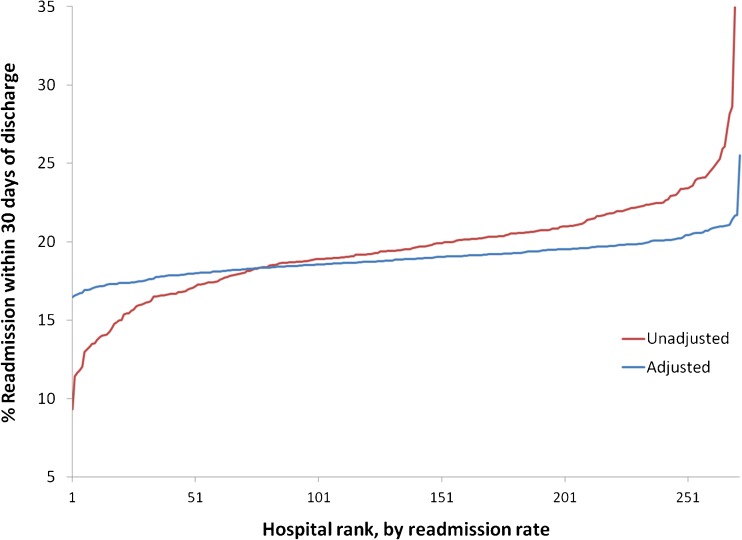
Figure 3.
Unadjusted (red) and adjusted (blue) 30-day readmission rates for the 272 Texas hospitals, by rank from lowest to highest. The adjusted rates were estimated from a multilevel model adjusting for patient characteristics, including age, sex, race, Medicaid eligibility, ER admission, weekend admission, MDC, DRG weights, 29 comorbid conditions, any nursing home stay in the prior 90 days, number of hospitalizations, number of outpatient physician visits, and presence of an identifiable PCP in the prior year.

