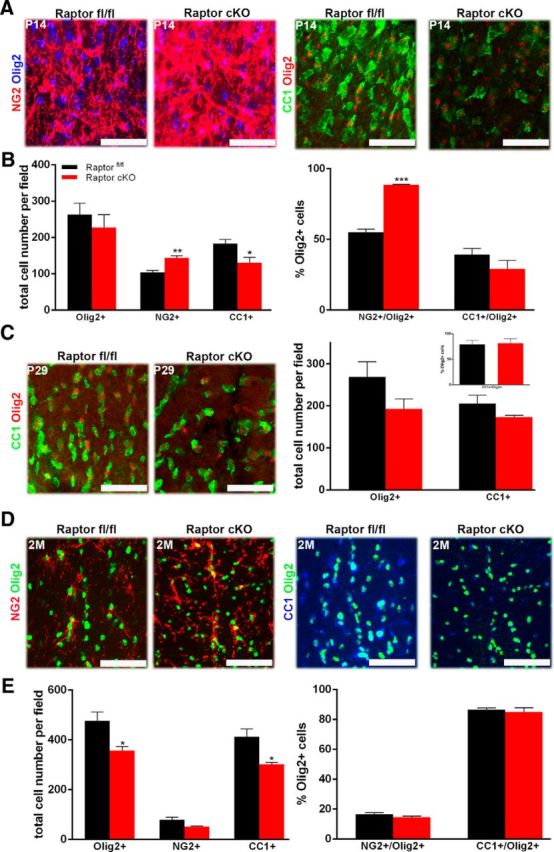
Figure 3.

Ablation of Raptor in spinal cord oligodendrocytes resulted in delayed maturation. P14 and P29 spinal cord sections were analyzed for total oligodendrocytes, OPCs, and mature oligodendrocytes. OPCs: representative image (A, left) and quantification (B) of total oligodendrocytes (Olig2: blue) or OPCs (NG2:red) in the P14 cervical dorsal columns of Raptorfl/fl (black) and Raptor cKO (red) mice. Mature oligodendrocytes: comparable P14 sections (A, right) were also stained for total oligodendrocytes (Olig2:red) and mature oligodendrocytes (CC1:green). Quantification was from n ≥ 3 sections from n ≥ 3 animals. The left graph (B) represents the total number of Olig2-, NG2-, or CC1-positive cells per field. The right graph is the percentage of the total Olig2-positive cells that double labeled for NG2 or CC1. Since a small number of either NG2-positive or CC1-positive cells did not also express Olig2, they were not included in this quantification. C, P29 spinal cord sections were stained for Olig2 (red, all oligodendrocyte lineage cells) and CC1 (green, mature oligodendrocytes). Representative image (left) and quantification (right) of total oligodendrocytes and mature oligodendrocytes in the cervical dorsal columns of P29 Raptorfl/fl and Raptor cKO mice. The main graph represents the total number of Olig2-positive or CC1-positive cells. The inset graph demonstrated that the percentage of the total Olig2-positive cells that double labeled for CC1 was normal. Since a small number of CC1-positive cells did not also express Olig2, they were not included in this quantification. D, Representative images of 2 month (2M) Raptor cKO and Raptorfl/fl controls stained with NG2 (red), CC1 (blue), or Olig2 (green; top). E, Quantification showed that the total number of Olig2-positive cells and CC1-positive cells was significantly decreased in the Raptor cKO animals (bottom left), but the percentage of CC1 or NG2-positive/ Olig2-positive cells was not significantly different in the Raptor cKO animals compared with the control (bottom right). Quantification was from n ≥ 3 sections from n ≥ 3 animals. Scale bars, 50 μm. Values displayed as ±SEM (n = 4, *p < 0.05, **p < 0.005, ***p < 0.001).
