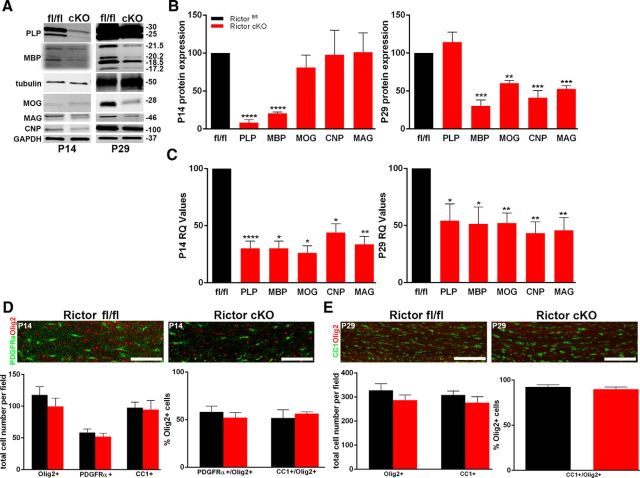
Figure 8.
Selective myelin proteins and RNAs were impacted in the corpus callosum of Rictor cKO mice. Representative Western blots (A) and quantification (B) of myelin proteins from P14 (B, left graph) and P29 (B, right graph) oligodendrocyte-enriched corpus callosum lysates. qPCR analysis of the transcriptional profile for myelin RNAS in P14 (C, left graph) and P29 (C, right graph) corpus callosum lysates from Rictor cKO and control animals. D, Representative immunohistochemically stained sections (Olig2, red; PDGFRα, green; top) and quantification (lower graph) of cells in the corpus callosum of P14 floxed Rictor (black) and Rictor cKO (red) animals. The main graph represents the total number of Olig2-positive or PDGFRα-positive cells. E, Representative immunohistochemically stained sections (Olig2, red; CC1, green; top) and quantification (lower graphs) of cells in the corpus callosum of P29 Rictorfl/fl and Rictor cKO animals. The main graph represents the total number of Olig2-positive or CC1-positive cells. Scale bars, 200 μm. Values are displayed as ±SEM (n ≥ 3, *p < 0.05, **p < 0.005, ***p < 0.001, ****p < 0.0001).

