
Figure 9.
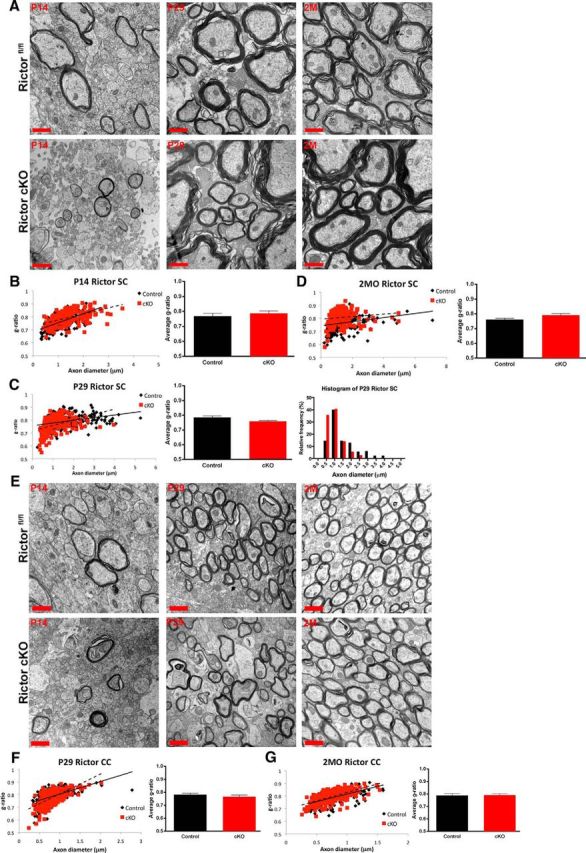
The ultrastructure of the myelin sheath was unperturbed when Rictor was ablated in the oligodendrocytes in spinal cord or corpus callosum. A, Electron micrographs of the dorsal columns (P14, left; P29, middle; 2 months (2M), right) cervical enlargements of the spinal cord. Quantification of the g-ratio of P14 (B), P29 (C), and 2month (2MO) tissue (D). Note that at P29 there is a significant increase in the frequency of small caliber axons in the Rictor cKO compared with control animals. Note no change in g-ratio at any age (bottom). E, Electron micrographs of P14, P29, and 2M tissue at the midline of the corpus callosum of floxed Rictor (black) and Rictor cKO (red) animals. F, G, Quantification of the g-ratio of P29 and 2MO. Scale bar, 1 μm. Values are displayed as ±SEM (n = 3).