Figure 2.
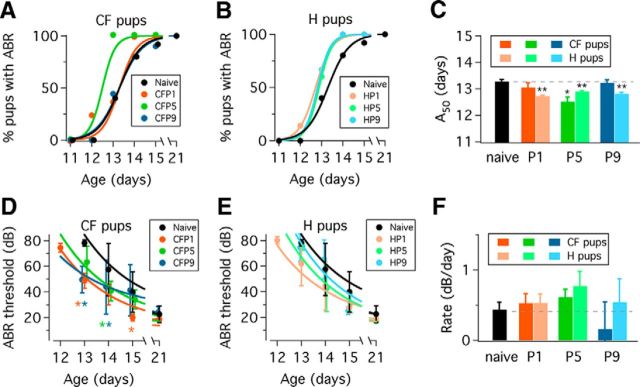
Functional changes during the onset of hearing in naive, CF and H groups. A, Percentage of pups with ABRs in CF groups during the onset of hearing. B, Percentage of pups with ABRs in H groups during the onset of hearing. Naive pup data are plotted in black circles in A and B. Continuous lines are fits to equation 1 (see Materials and Methods). C, Summary of A50 values obtained from fits to equation 1. Color indicates the age of manipulation: P1 (orange), P5 (green), and P9 (blue). Bright colors indicate CF condition. Light colors indicate H condition. Dashed line represents naive A50 value, shown as a black bar (*p < 0.01; **p < 0.001). Error bars in C represent SEM. D, ABR thresholds in CF pups at different postnatal ages. E, ABR thresholds in H pups at different postnatal ages. Black circles represent naive pup data in A and B. Asterisks indicate statistically significant differences between CF pup ABR thresholds and naive ABR thresholds at a particular age (two-way ANOVA Dunnett's multiple-comparisons test; p < 0.0001). F, Rate of ABR threshold change obtained from fitting data in A and B to Equation 2 (see Materials and Methods). Dashed line represents naive ABR threshold rate of change, also shown as a black bar. A, B, Data represent mean ± SD. Error bars in C represent SEM.

